- The R Leo ObsWin created in the previous step clearly reveals the presence of a periodic signal. Let's first make a visual inspection of the ObsWin to get a rough idea of the approximate period of R Leo. For this, we zoom in on the light curve, such that we see for instance 3 peaks. It is not important which peaks you select to zoom on. After zooming in, the ObsWin might look as follows:
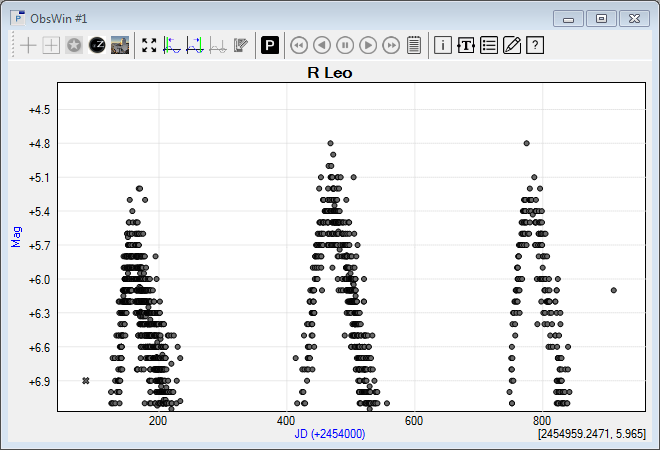
- Move the mouse over one of the observations at the top of the first peak and note the Julian Date value appearing in bold in the mouse coordinates (bottom right). E.g., 2,454,158 (we are not interested in the fractional part).
Repeat this step for the second peak, resulting f.i. in a value of 2,454,472. It is not important which observation you select at the top of the second peak, as we just need a rough estimate of the R Leo period. The difference between both values is 314 days.
Finally, do the same for an observation at the top of the third peak and calculate the difference with the second peak. This yields f.i. a value of 307 days.
Hence, it is safe to conclude that the period of R Leo is likely close to 310 days. Alternatively, you may also use the Measurement indicator to graphically measure the distance between peaks. You will notice that this is more convenient.
- Zoom out to display the full R Leo light curve again. Select Full View from the Observations window menu (or click the
 button in the Observations Window toolbar). button in the Observations Window toolbar).
- We are now ready to perform our first period analysis. Peranso offers a wide range of period analysis methods for time-series analysis. In this tutorial, we will use the Lomb-Scargle and ANOVA methods. We will start with Lomb-Scargle.
Select Lomb-Scargle... from the Period analysis menu (or click the  button in the ObsWin toolbar). This brings up the Period determination dialog box. button in the ObsWin toolbar). This brings up the Period determination dialog box.
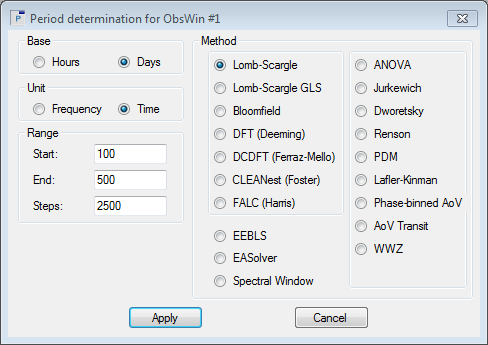
- It contains 3 important sections:
- Base. Peranso by default calculates periods in days, which is typical for variable star work. Minor planet periods are usually expressed in hours. You can select which base to use in this section. We will use Days for now.
- Unit. This section allows to toggle between Time or Frequency domain based calculations. If you select Time, then the X axis values will be expressed in days (or hours). If you select Frequency, the X axis values will be expressed in cycles per day (c/d) or cycles per hour (c/h). We will use Time for now.
- Range. Enter Start and End values to define the period scan range. We know from step 2 that the period of R Leo is around 310 days, but there might be other - less obvious - periods too, so let's enter a Start range of 100 days and an end range of 500 days. Resolution defines the step size to be used by Peranso in the period analysis. A high value will ensure that you won't miss any significant peak, but at the cost of CPU time. We will use a value of 2500 steps. If needed, we can rerun the period analysis later on with a higher step value.
- Click Apply to start the period calculations. A progress bar pops up and remains visible till all calculations have completed. When done, a new Period Window appears. Close the Period determination dialog box by clicking the Cancel button.
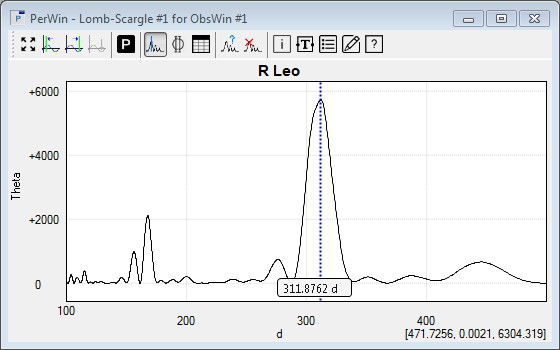
- The PerWin X axis displays the time Range over which the period analysis has been made, using the Start and End values you entered in Step 5. On the Y axis it displays the Lomb-Scargle Theta statistic. The higher this value is, the more 'dominant' the corresponding peak is.
The most dominant period in the Period Window is marked by a Frequency cursor (dotted blue vertical line). The corresponding Time (or Frequency) value is shown at the bottom of the Frequency cursor. We conclude that R Leo's period is 311.9 days. This value is in perfect agreement with literature values mentioned at the start of this tutorial.
- Move your mouse close to the Frequency cursor. Click and hold the left mouse button to move the Frequency cursor in the PerWin. The Time value is continously updated. Doing so, you can quickly inspect other peaks in the PerWin.
Click twice on the Set/Unset Frequency cursor  icon in the PerWin toolbar to move the Frequency cursor back to the dominant period. icon in the PerWin toolbar to move the Frequency cursor back to the dominant period.
- Select Info in the Period window menu (or click on
 in the PerWin toolbar) to display the Info dialog box. in the PerWin toolbar) to display the Info dialog box.
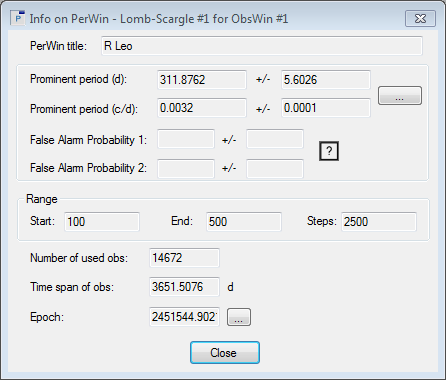
- The Info dialog box displays the Time and Frequency value of the dominant period, along with an estimate of the period uncertainty (period error), indicated by the values behind the +/- symbol. We thus conclude that R Leo has a period of 311.9 +/- 5.6 days. We furthermore see that 14,672 observations were used in the calculations, covering a time span of 3,652 days. Note that inactive and fainter-than observations are excluded from period analysis calculations. Close the dialog box.
|