Observations window
|
A Peranso Observations Window (short ObsWin) is used for drawing and manipulating time-series (light curves) of observations. The abscissa (X axis) of an Observations Window displays the time over which the observations are plotted, while the ordinate (Y axis) represents their brightness (magnitude or intensity). Each observation in Peranso is defined by following attributes:
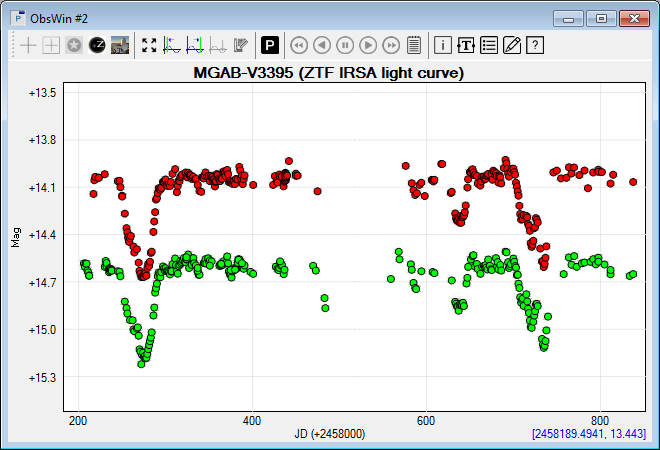
Observations are logically grouped in observation sets. Observation sets are typically used to make logical partitions in large volumes of observations, e.g., to partition per night or per observer. Peranso offers an extensive set of commands that operate on all observations of an observation set at once (e.g., to average an observation set). Below is an example of a Peranso Observations Window, showing two Observation Sets : one is colored in red, the other in green. The X axis of the ObsWin is labeled JD (Julian Date), and represents the time of the observations. The label +2458000 in the middle part is the Baseline time value. All X axis labels have to be read in relation to the Baseline value. Example : the X axis label 400 corresponds to a time value of JD 2,458,000 + 400 = 2,458,400. The Y axis of the ObsWin is labeled mag (magnitude), representing the brightness of the observations. The label [2458189.4941, 13.443] in the bottom right part displays the mouse coordinates (time, brightness). When the mouse cursor is over an observation, the exact time and brightness of that observation are shown in the color of the corresponding Observation Set. In addition, the font type of the mouse coordinates changes to 'bold'. If the mouse cursor is not over an observation, then the time and brightness of the cursor position are shown instead, in a light blue color and using a normal font type. If the observation below the mouse cursor has a Brightness Error value, then that value is shown as well in the mouse coordinates display. Depending on the Observation Window type, additional observation attributes (such as Filter and Observer) may appear as well. The area of the Observations Window in which the light curve is drawn, is called the plot area.
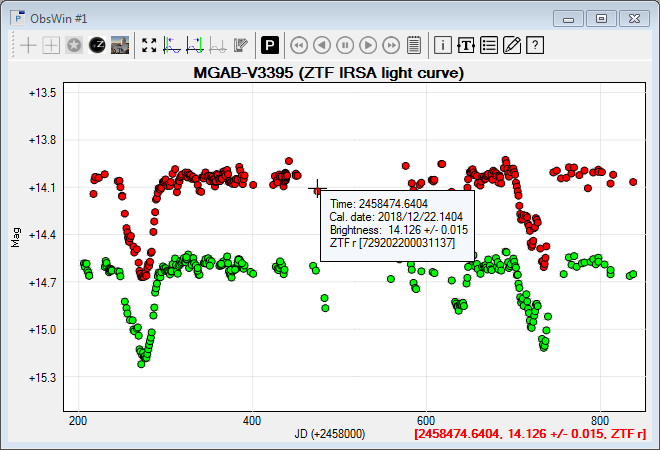
ObsWin with ZTF observations in r and g filter of the variable star MGAB-V3395. The red colored observation set If you move the mouse over an observation, a callout will pop up, showing all known observation attributes of that observation. Next to the time in Julian Date format, also the Calendar Date will be shown. The user can toggle the appearance of the observation callout box.
Same ObsWin as above with a callout showing the Julian and Calendar Dates of the marked observation, as well as its magnitude, magnitude error and filter (ZTF r). The number next to the filter denotes the ZTF ObjectID for this observation. The toolbar in the upper part of the Observations Window groups frequently used ObsWin commands. Almost all graphical properties of an ObsWin can be modified by the user. This includes axes titles, the mouse coordinates label, the ObsWin title, and so on. Left click the mouse on the label of interest to modify the label text. Right click to change the font and color. |