|
Starting from the R Leo Period window of the previous step, we will now create a Phase Window. It displays a phase diagram by folding all R Leo observations used in the period analysis calculations over the dominant period of 311.9 days, resulting in a plot of the variable's brightness versus its phase.
- Select PhaseWin at Frequency cursor value in the Period analysis menu (or click on
 in the PerWin toolbar). This creates a Phase Window. Note that the caption, displayed in the ornament of the PhaseWin, shows the association with the corresponding PerWin, as well as the dominant period value used for creating the phase diagram. in the PerWin toolbar). This creates a Phase Window. Note that the caption, displayed in the ornament of the PhaseWin, shows the association with the corresponding PerWin, as well as the dominant period value used for creating the phase diagram.
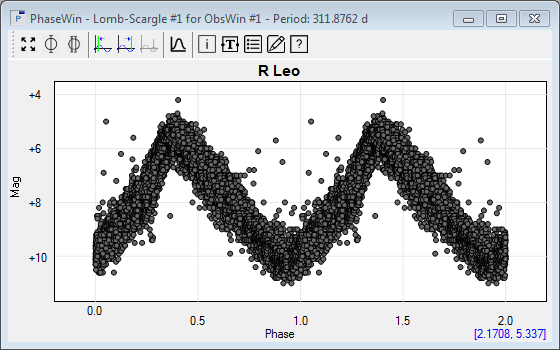
- The PhaseWin shows a typical Mira-type long-period variable star phase diagram.
- Select Info in the Phase window menu (or click on
 in the PhaseWin toolbar) to display the Info dialog box. in the PhaseWin toolbar) to display the Info dialog box.
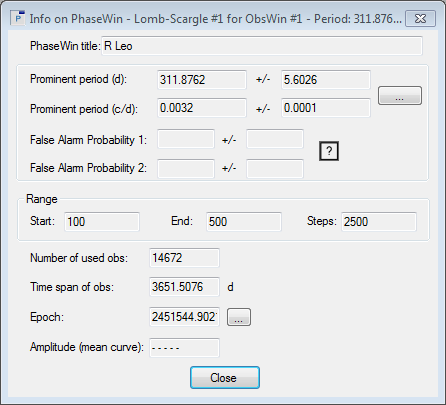
- The information displayed in the Info dialog box is quite similar to the information seen in the Info box of the PerWin (see previous section). There is an additional interesting field Epoch. It displays the epoch time, which is the starting time used by Peranso for calculating the phases of a PhaseWin. By default it corresponds with the Julian Date of the first active and not fainter-than observation in the ObsWin.
If you want to display a phase diagram with a different epoch time, then click the button with the 3 dots next to the Epoch value. It brings up the Epoch form, allowing you to enter a different value. Enter for instance 2451700 and click OK to close the Epoch form. This will redraw the PhaseWin with an updated phase diagram. You can revert back to the default Epoch value, by re-opening the Epoch form and clicking the Reset button followed by OK.
Now Close the PhaseWin Info dialog box.
|