Creating the R Leo light curve
|
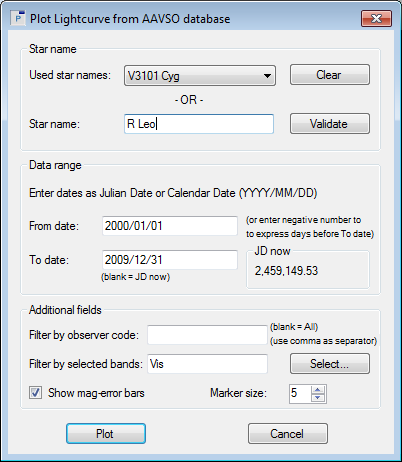
We will first load the R Leo observations in a Peranso Observations Window. You have two options for this:
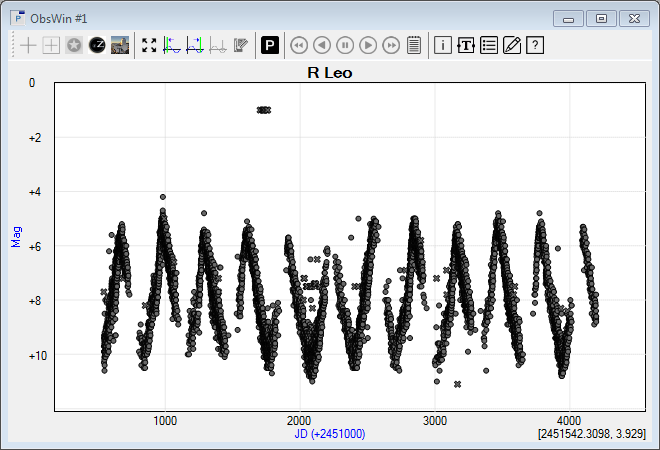
In the section Loading observations from a Peranso project of Tutorial 1, we have learned how to create an Observations Window by opening the corresponding Peranso tutorial project file. Repeat these steps for R Leo, this time selecting the tutorial folder 2. Performing a period analysis. In both cases, your newly created ObsWin should look as follows:
Using the Observations Window Info box (see Tutorial 1) you can cross check that your light curve contains approximately 14.748 observations (the actual number might be slightly different, as the AAVSO AID is being constantly updated). |