|
We will first learn how to plot observations of the variable star V3101 Cyg in Peranso, by loading them from the AAVSO International Database (AID).
- Launch Peranso
- This brings up the empty Peranso Desktop Window.
- Select New in the File menu (or click on
 in the main Toolbar) to open a new Observations Window (ObsWin). This brings up an empty ObsWin in the Peranso Desktop. Observations Windows are used to display light curves. in the main Toolbar) to open a new Observations Window (ObsWin). This brings up an empty ObsWin in the Peranso Desktop. Observations Windows are used to display light curves.
- The toolbar of the ObsWin contains several buttons. Click on
 (Add Internet light curve). This brings up a menu. Select the (Add Internet light curve). This brings up a menu. Select the  AAVSO light curve entry to display the below dialog box. AAVSO light curve entry to display the below dialog box.
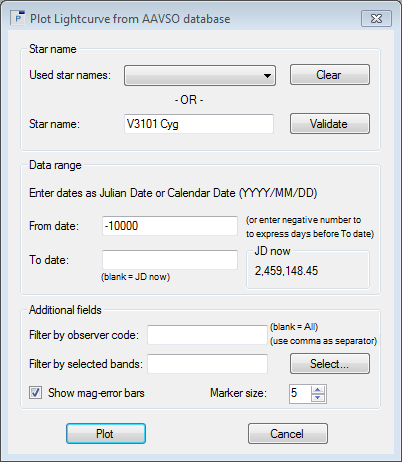
- This dialog box contains 3 sections: Star name, Data range and Additional fields:
- In the Star name section, there's an empty field labeled Star name. Enter V3101 Cyg. If you first want to validate that this is a correct designation in the AAVSO database, you can click the Validate button. This is optional.
- In the Data range section, you have to define the date interval for which you want to retrieve observations of V3101 Cyg. Dates can be entered in Calendar Date format (YYYY/MM/DD) or in Julian Date format. Let's first enter the To date. You can either enter a specific date (for instance today's date) or simply leave the field empty, in which case Peranso automatically will use today. Leave it empty for this tutorial.
Next we enter the From date. Since we don't know a priori when the first observation of V3101 Cyg was made, you can enter a date far in the past (e.g., 1900/01/01). You can also enter a negative number (e.g., -10000). This expresses the number of days to be subtracted from the date entered in the To date field. Let's enter -10000.
- In the Additional fields section, we can define additional filters to be used for the retrieval of the observations. For instance, if you are only interested in the observations of a specific observer, you can enter his/her AAVSO ObsCode in the Filter by observer code. Leave it blank for now. You can also retrieve observations made in a specific "band" or filter. We will explain this in the next section of this tutorial. For now, leave the field blank.
If observations in the AAVSO AID have a brightness error, Peranso will display error bars to denote the error region. The default behavior of Peranso is to display error bars, unless you deselect the Show mag-error bars box.
Finally, the Marker size defines the size of the dots used for drawing the observations. Each dot represents one observation, and is drawn in the color of the band (filter) in which the observation was made. This will be further explained in the next section.
- Next click the Plot button. A dialog box Downloading observations from AAVSO website will pop up, informing you that the AAVSO AID is being contacted to retrieve the observations. Depending on the number of observations to be downloaded and the actual load of the AAVSO servers, this operation may take anywhere from a few seconds to a minute or so.
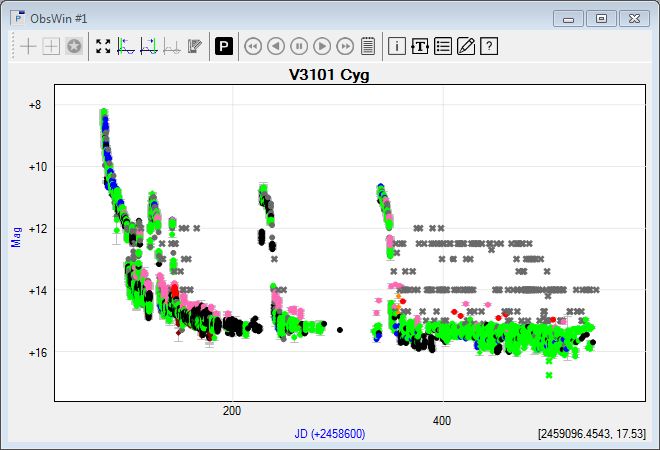
- Once the download is complete, the ObsWin will display all V3101 Cyg observations. You now have successfully created your first AAVSO light curve using Peranso.
Please note that observations downloaded from the AAVSO website into Peranso are always displayed in JD, not HJD.
- If you create a new ObsWin and then re-open the Plot Lightcurve from AAVSO database dialog box, you will see in the Star name section that the field Used star names is no longer empty. It contains V3101 Cyg. For each AAVSO light curve that you plot, this field will recall the star name you entered, making it more convenient to repeat searches in the future. Click the Clear button to erase all entries in the Used star names field.
- As a final step, we will save this light curve to file, such that you can re-open it later on, without having to download again the observations from the AAVSO AID. Select Save As... in the File menu (or click on
 in the main Toolbar). This will open a Windows Save As file dialog. Browse to a folder of your preference and click Save. in the main Toolbar). This will open a Windows Save As file dialog. Browse to a folder of your preference and click Save.
|