|
We will now analyse the V3101 Cyg light curve in more detail. We assume the corresponding ObsWin is still open in your Peranso Desktop.
Obtaining general information about the light curve
- Select Info... from the Observations window menu or click the
 Info button in the toolbar of the Observations Window. This brings up the Info dialog box: Info button in the toolbar of the Observations Window. This brings up the Info dialog box:
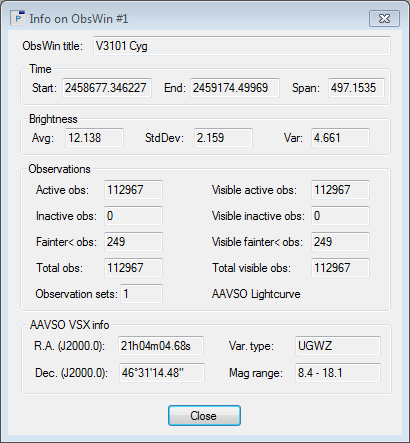
- It has 4 sections:
- Time. Start and End denote the time of resp. the first and last active observation in the ObsWin and the time span, expressed in the X axis units (in this example, days).
Note: the actual values you see in your Peranso Info dialog box might differ from the above, as observations of V3101 Cyg continue to be submitted to the AAVSO International Database.
- Brightness. Avg shows the average brightness of all active observations in the light curve. StDev shows the standard deviation and Var the variance of these active observations.
- Observations. Active obs and Inactive obs show resp. the number of active and inactive observations in the light curve. Their sum is shown in Total obs. When you zoom in or out on the light curve, you will see a fraction of the total observations. Visible active obs shows the number of currently visible active observations. The number of observations not displayed in the ObsWin is given by Visible inactive obs. The number of Fainter-than obs is displayed in the Fainter< field. Inactive and Fainter-than observations are excluded from period analysis calculations. We will learn in Tutorial 3 Finding multiple periods through Prewhitening how to work with Observation sets. An AAVSO light curve has only 1 Observation set.
- AAVSO VSX info. The AAVSO Variable Star Index (VSX) is a large database (repository) with up-to-date information about a very large number of variable stars. It includes a/o the coordinates of each variable star, its variability type, magnitude range, etc. Peranso displays a subset of the VSX information for the variable star shown in ObsWin: the coordinates (R.A. and Dec.), variability type (Var. type) and the brightness range (Mag range). If you have no active Internet connection, this section is not shown.
Who contributed observations to the light curve?
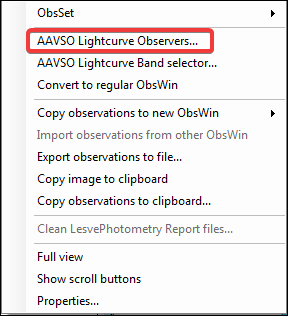
- Move the mouse over the plot area of the V3101 Cyg ObsWin. Now do a right click to bring up the ObsWin context menu. Select AAVSO Lightcurve Observers...
- The Observers dialog box shows a table of all observers who contributed to the light curve. Each row represents one observer, and shows the observer's AAVSO ObsCode, name, the number of observations he contributed, the bands (filters) used, the country in which the observer resides, the astronomical society or club he/she belongs to.
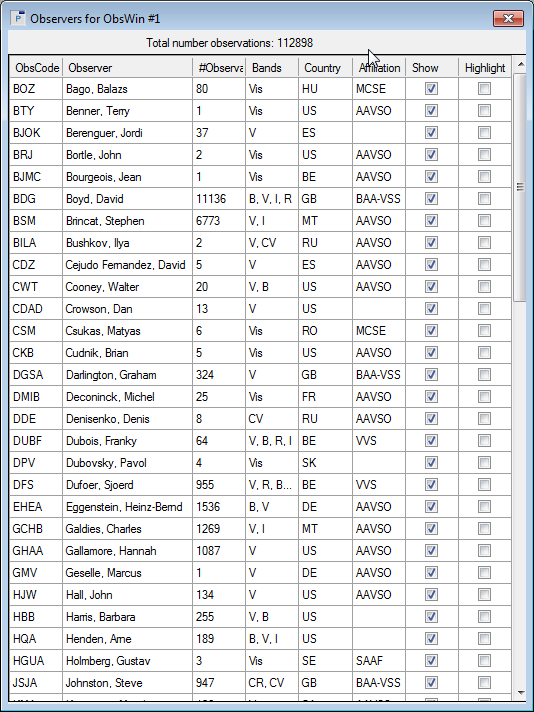
- The Show box in each row by default is selected. If you deselect it, the light curve will be updated to hide the observations of that observer.
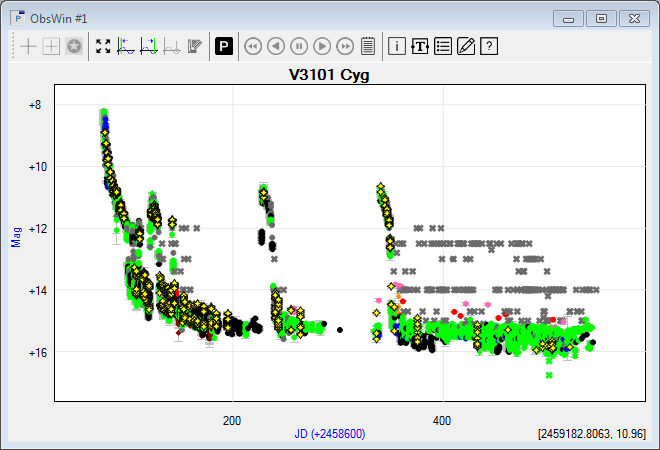
- The Highlight checkbox by default is deselected. If you select it, the light curve will be updated and the observations of that observer will appear in bright yellow, making it easy to distinguish them from all other observations. If you highlight the observations of observer BDG, the ObsWin becomes:
- You can click the column headers of the dialog box to sort it according to the selected column. For instance, if you want to see who contributed most observations, then click twice on the #Observations column.
Working with the Lightcurve Band selector
- Move the mouse over the plot area of the V3101 Cyg ObsWin. Now do a right click to bring up the ObsWin context menu. Select AAVSO Lightcurve Band selector...
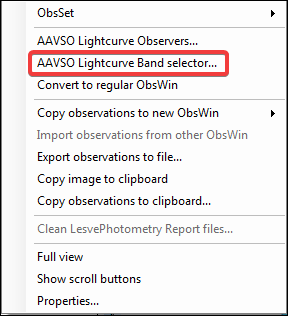
- The AAVSO Lightcurve Band selector is a dialog box showing all bands (filters) supported by the AAVSO when reporting observations. Popular bands include Vis (visual observations), CV (unfiltered CCD observations), U-B-V-R-I, etc.
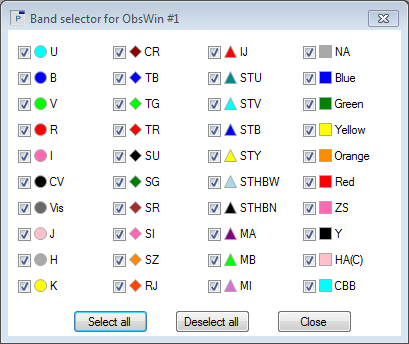
- Each band name has a box. If it is checked, observations made in that band will be displayed in the ObsWin. Use the Select all button to turn on all bands. Use the Deselect all button to turn off all bands, making ObsWin empty.
- If a band is deselected, the corresponding (invisible) observations will be excluded from several Peranso operations, including period determination methods, detrending operations, etc.
Handling large amounts of observations
Your AAVSO light curve contains more than 112,000 observations. You will nevertheless notice that zoom, pan and other operations perform smoothly. Peranso uses an innovative drawing technique to optimize the amount of observations to be drawn at any given moment, while still preserving the overall shape and characteristics of the light curve.
You can of course opt to turn off this optimization, in which case you can still handle all observations, but with a decreased graphical responsiveness.
- To modify how Peranso deals with large amounts of observations, select Settings... in the File menu. The Settings dialog box contains 4 tabs. Select Windows.
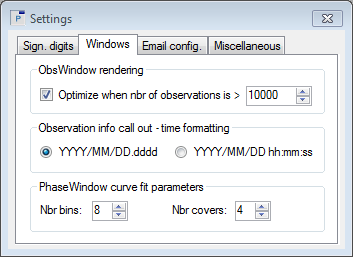
- The ObsWindow rendering section contains one entry. If you deselect the Optimize when box, Peranso will no longer draw observations in optimized mode. If you select the box, you can use the up-down field to determine when the optimized drawing should come into effect. E.g., if you select 10000, Optimized drawing will apply to light curves with more than 10,000 observations. Light curves with less observations will be drawn in regular mode.
We recommend to turn on the Optimize when box, and to select a value of 10,000 observations for PC's or laptops with a low performance graphics card. On high-end PC's, you can set the value to f.i. 25,000 or 30,000 observations.
|


