- To move a Frequency cursor, position the mouse cursor near the Frequency cursor. Then click and hold the left mouse button while moving the mouse. The Frequency cursor will follow the mouse movements and its value will be continuously updated. Release the left mouse button to stop. If a Phase window exists for this Period window, then the contents of the Phase window will be updated while moving the Frequency cursor. When displaying a large volume of observations in the Phase window, this may take some processing time.
- To remove (unset) a Frequency Cursor, click the Set/unset frequency cursor button, or select Hide Frequency Cursor from the Period Analysis menu.
- To modify the visual appearance of a Frequency cursor, use the Properties dialog box.
- If you double click on a Frequency cursor, an Enter period value box will pop up. It allows you to enter a period value. If you click the Apply button, the PhaseWin will be updated to show the phase diagram corresponding with the entered period. If no PhaseWin existed yet, a new one will be created.
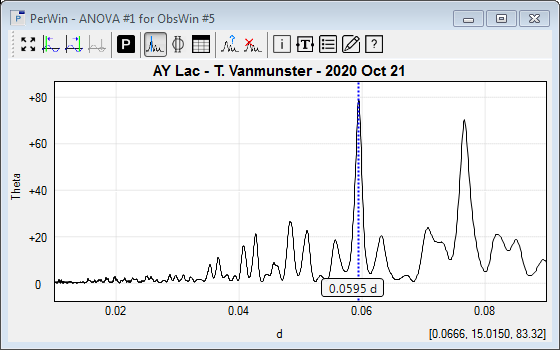
The blue dotted line represents the Frequency cursor in this Period Window. The label at the bottom of the cursor (0.0595 d) shows the value of the dominant period.
|
