

Peranso includes these powerful features. Detailed information is available in the online User Guide.


Copyright © 2026 - CBABelgium.com. All rights reserved

Peranso

Light Curve and Period Analysis Software
•
An extensive set of period analysis methods to detect periodicities in time-series data :
Lomb-Scargle, Generalized Lomb-Scargle, Bloomfield, Discrete Fourier Transform DFT (Deeming), Date Compensated Discrete Fourier Transform DCDFT (Ferraz-Mello), CLEANest (Foster), FALC (Harris), Jurkewich, PDM (Phase Dispersion Minimization), Dworetsky, Renson, Conditional Entropy CE, Analysis of Variance ANOVA (Schwarzenberg-Czerny), Phase-binned AoV (Schwarzenberg-Czerny), Lafler-Kinman, Planetary Transits AoV, WWZ (Weighted Wavelet Z-Transform) (Foster), EEBLS (Kovacs) for exoplanet transits.
Lomb-Scargle, Generalized Lomb-Scargle, Bloomfield, Discrete Fourier Transform DFT (Deeming), Date Compensated Discrete Fourier Transform DCDFT (Ferraz-Mello), CLEANest (Foster), FALC (Harris), Jurkewich, PDM (Phase Dispersion Minimization), Dworetsky, Renson, Conditional Entropy CE, Analysis of Variance ANOVA (Schwarzenberg-Czerny), Phase-binned AoV (Schwarzenberg-Czerny), Lafler-Kinman, Planetary Transits AoV, WWZ (Weighted Wavelet Z-Transform) (Foster), EEBLS (Kovacs) for exoplanet transits.
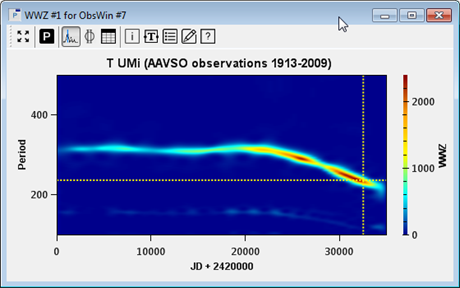
WWZ period window
•
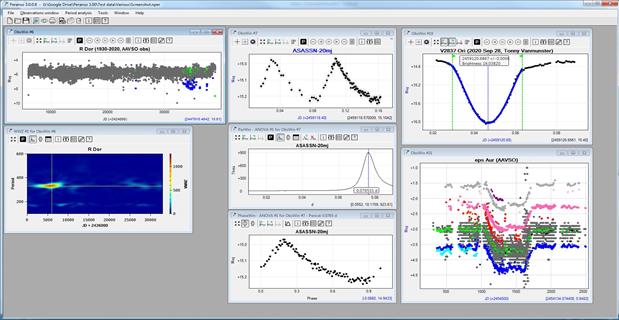
Multiple window types to display observation sets, period diagrams, phase diagrams, etc. Each observation set is drawn in a distinctive color, that is consistently used throughout all related windows.
Left colum: Observations window and corresponding WWZ Period window
Middle column: Observations window with corresponding Period window and Phase window
Right column top: Extremum finding in an Observations window
Right column bottom: auto-generated AAVSO Observations window
Middle column: Observations window with corresponding Period window and Phase window
Right column top: Extremum finding in an Observations window
Right column bottom: auto-generated AAVSO Observations window
•
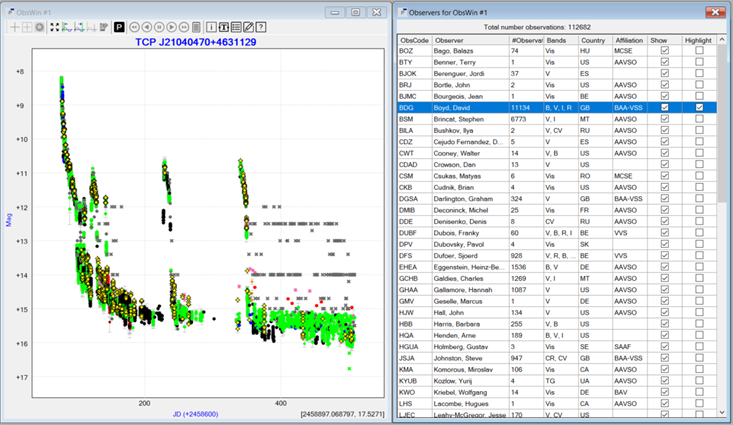
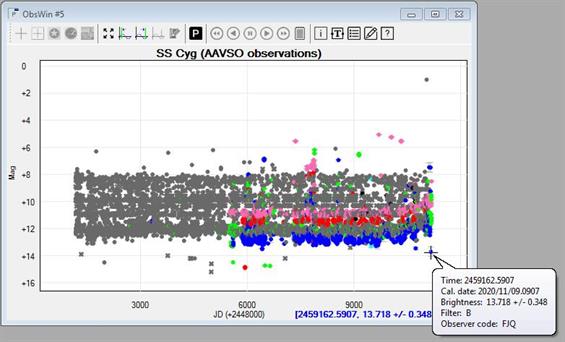
Directly generate light curves from the AAVSO database. Observations are online retrieved upon simply entering the name of the variable and the time range. Easily generate lists of observers, highlight observations of one or more observers, or select observations based on filter settings.
Left: AAVSO Observations window. Right: list of contributing observers, showing their affiliation, number of contributed observations, used filters, etc. An "highlight" toggle allows you to highlight the observations contributed by one or more individual observers. They appear as yellow markers in the Observations window.
•
Directly generate ZTF light curves from the Lasair Transients and Variables website or NASA Infrared Science Archive (IRSA). Observations are online retrieved upon simply entering the name of the variable or its coordinates, and a search radius
•
Import observations using the Microsoft Windows clipboard
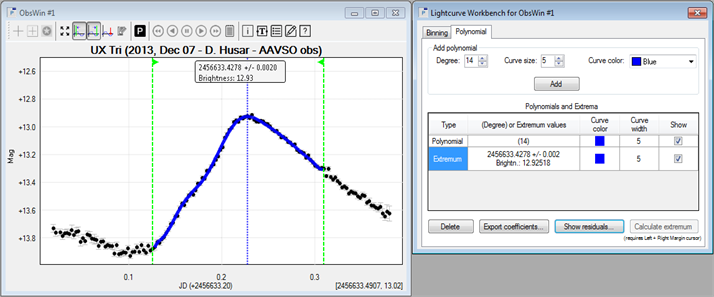
Left: Polynomial fit and corresponding extremum. Right: Lightcurve Workbench
•
Visualization of the CLEANest Model Function, showing how selected frequencies/periods fits the observations, completed with the ability to show Residuals, resulting from subtracting the Model Function form the observations.
•
Seamless integration with Phoranso and LesvePhotometry, allowing to directly plot a light curve from an AAVSO or CBA (Center for Backyard Astrophyics) Photometry report file. You can also clean your photometric reports by graphically marking incorrect observations in the Observations window and initiating a one-step cleaning process of the report.
•
Period determination of eclipsing Algol-type (EA) binaries using the EASolver method (Wils). It works on photometric survey data with only few observations showing the variable in faint state.
•
Calculating and drawing Period windows has become significantly faster compared to Peranso 2, using some novel techniques. Compute-intensive operations, such as a Significance Analysis, easily required 30 minutes or more to complete in Peranso 2. They now on average complete in less than a minute.
•
Easily visualize light curves with several hundred thousand of observations. Peranso uses an innovative drawing technique to optimize the amount of observations to be drawn, while still preserving the overall shape and characteristics of the light curve. Using a low-end laptop, it takes less than a few seconds to draw a light curve with over 600,000 observations, and to zoom in on any particular section
•
When hoovering the mouse over an observation in an Observations window, a call-out box shows up with relevant information about the observation, including the time (Julian and Calendar Dates), brightness, used filter, observer name (if applicable), etc
•
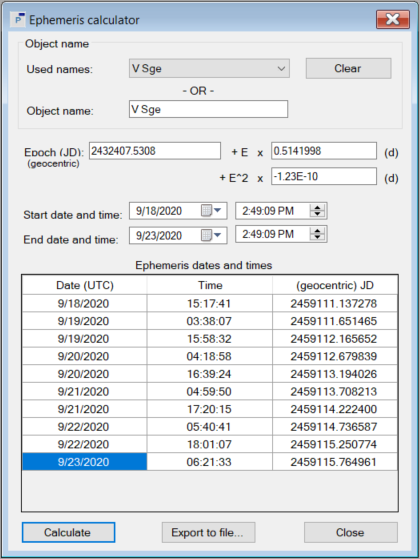
Next to a Julian Date calculator, Peranso also includes an Ephermeris Calculator (see figure at right), that generates an ephemeris for exoplanet transit times, or for variable star eclipse times. Simply enter the name of the object, the epoch data and the observing interval, and you will get the list of all ephemeris dates and times, expressed in Julian Date and Calendar Date formats
•
Temporary deactivate observations and study the impact on your period analysis results
•
Next to AAVSO and ZTF, Peranso 3 allows to
directly generate light curves from following
surveys and databases (without having to visit a
survey's website and make complex queries):
ASAS-3, Catalina Surveys DR3, Gaia (DR3,
Alerts), Hipparcos, Kepler, Kepler K2, NSVS,
PanSTARRS1 DR2, SkyMapper DR2, TESS
and SuperWASP.
Next to the display of TESS short cadence and
long cadence LCF (Light Curve FIles), Peranso
allows users to also extract and analyze light
curves directly from TESS FFI (Full Frame Images).
For this capability, Peranso integrates a proprietary
photometry module.
•
Natively import file-based observations from Microsoft Excel, AIP4Win v2, AAVSO Extended File Format EFF, AAVSO International Database AID, ASAS (All Sky Automated Survey), ASAS-SN (All-Sky Automated Survey for Supernovae), Phoranso, LesvePhotometry, DASCH (Digital Access to a Sky Century at Harvard) and ALCDEF (Asteroid Light Curve Data Exchange File)
•
A unique Lightcurve Workbench for advanced light curve analysis, comprising functions for data reduction (binning), polynomial fitting, extremum finding, etc. We also added LOWESS (locally-weighted scatterplot smoothing) fitting and detrending to smooth light curves and to auto-detect outliers (observations that may be removed from the light curve).
•
User controlled "prewhitening" routine for elimination of aliases and confirmation of secondary periods
•
Particularly effective, fully-automated multi-period analysis function using the CLEANest / SLICK method by Grant Foster
•
Analyse photometric time series in search for periodic transits by exoplanets, using the EEBLS (Edge Enhanced Box-fitting Least Squares) method by Kovacs. Calculate and visualize the EEBLS frequency spectrum, fold the time series over the most significant EEBLS period, calculate the epoch of mid-transit events, the transit depth and duration and graphically display the fit obtained by the EEBLS method.

Upper Left: Observations window with >15,000 TESS observations of exoplanet XO-1b
Lower left: EEBLS period window showing the transit period
Upper right: Phase window folded over transit period with EEBLS fit
Lower right: binned Phase window using 25 observations per bin
Lower left: EEBLS period window showing the transit period
Upper right: Phase window folded over transit period with EEBLS fit
Lower right: binned Phase window using 25 observations per bin
•
Determination of period error values (uncertainties) based on a method by Schwarzenberg-Czerny
•
Sophisticated calculation of False Alarm Probabilities to determine the period significances, using a Fisher Randomization method (Monte-Carlo permutations)
•
Extremum finding based on (a) the Kwee-van Woerden algorithm, or (b) local minima/maxima determination through polynomial fitting
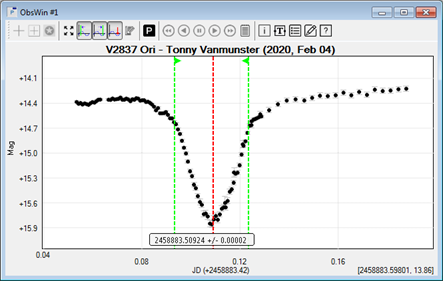
Mid-eclipse determination of V2837 Ori using Kwee-van Woerden. The result is marked with the red extremum indicator showing the Julian Date of the mid-eclipse. The green markers indicate the interval in which the minimum has to be determined.
AAVSO light curve of SS Cyg with over 457,000 observations drawn with optimized rendering. An observation call-out box appears at the bottom right
•
Powerful data and image export capabilities (to file or to clipboard)
•
Measurement tool to measure the distance between two observations in an Observations or Phase window.
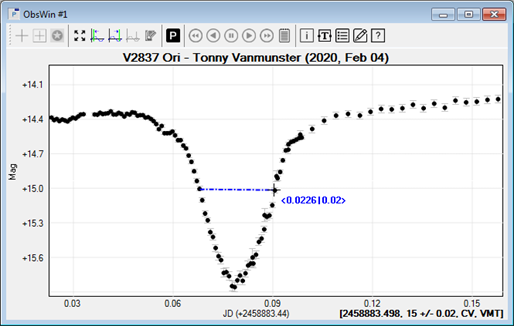
Measurement indicator (blue color)
•
"One-button-Save" to store all analysis windows on disk and to continue your work in identical conditions at a later stage
•
Email utility to send AAVSO or CBA Photometry reports directly to one or more recipients, by simply clicking on the light curve
•
Toolbars, cursors and indicators let you select prominent periods, indicate intervals for refinement of your period analysis, etc
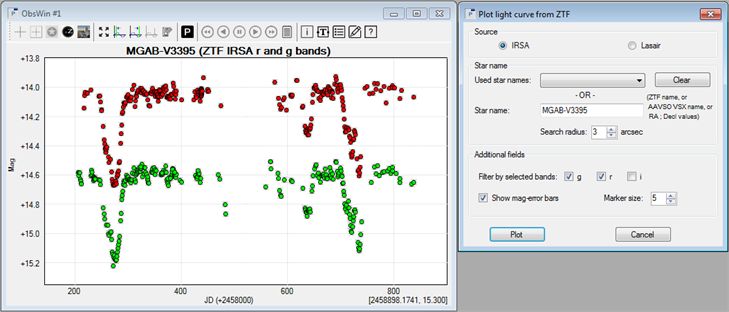
Left: ZTF IRSA light curve of MGAB-V3395. Right: One-click plot dialog box to generate ZTF light curves

Left: Observations window showing RX Cap observations as gray dots. The cyan dots are the Residuals resulting from subtracting the CLEANest Model Function (drawn in green) from the observations. Right: CLEANest Period window highlighting (blue bars) the two dominant periods
•
Easy navigation bar to step through and zoom in on Observation sets. Scroll buttons allow you to pan a light curve.
•
Fully customizable windows: axes, grids, window annotation, trendlines, colors, etc.
•
Full compatibility with Peranso 2: all of your Peranso 2 files will open in Peranso 3 and render correctly, withous loss of any data
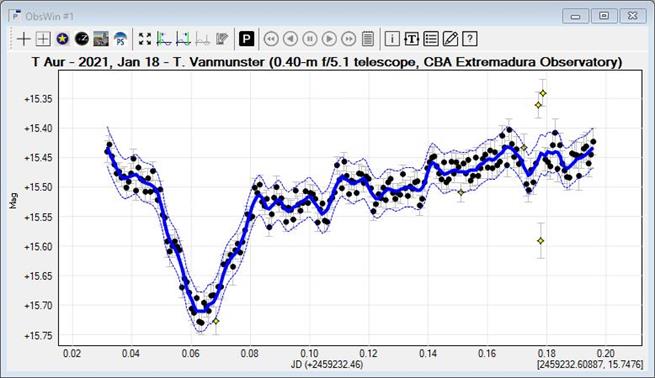
Auto-removal of outlier observations from the light curve of T Aur. The thick blue line is the (LOWESS) smooth line. Above and below the smooth line are thin lines, marking the envelope region. Observations outside the envelope are considered outliers and drawn in bright yellow. They can subsequently be de-activated to exclude them from period analysis calculations. Even in complex light curves, it will take you just a few seconds to identify outliers.
