- Select Open in the File menu (or click on
 in the main Toolbar) to display the File Open box. Navigate to the Peranso Tutorials 9 folder. To do so, first locate your My Documents folder (typically C:\Users\<your_user_name>\Documents). In there is a subfolder Peranso, then select the subfolder Tutorials. Finally, select the folder 9. Finding extrema in observations. Select the file Light curve P1 and click the Open button. in the main Toolbar) to display the File Open box. Navigate to the Peranso Tutorials 9 folder. To do so, first locate your My Documents folder (typically C:\Users\<your_user_name>\Documents). In there is a subfolder Peranso, then select the subfolder Tutorials. Finally, select the folder 9. Finding extrema in observations. Select the file Light curve P1 and click the Open button.
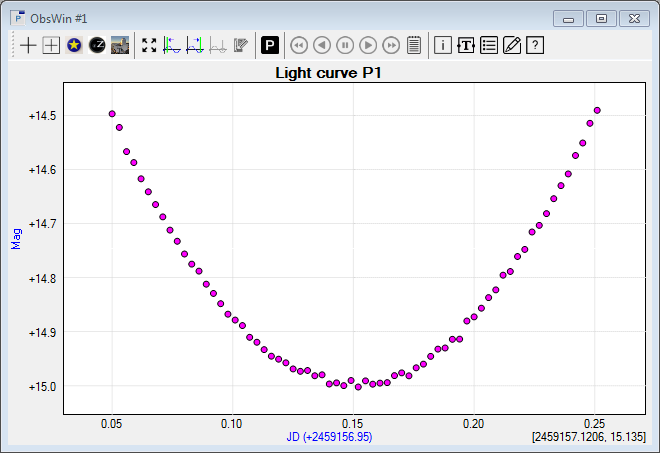
- The new ObsWin with Light curve P1 contains pseudo-observations which have been generated using a parabolic generation function, covering a duration of 0.2 days, with the ToM being close to the JD 2,459,157.1 point. Brightness values were selected such that the minimum magnitude was about 0.5 magnitude fainter than at the start of the observations. The interval between observations was set at 0.003 days. The light curve is symmetric, but we added random noise, such that the light curve characteristics are rather close to a real light curve.
- We will now determine the Time of Minimum (ToM) using the Kwee-van Woerden method. We first have to mark the X-axis interval of the light curve where Kwee-van Woerden should operate. We do this by using a Left Margin cursor and Right Margin cursor. The margin cursor section explains how to set the cursors.
In general, we recommend to position the margin cursors such that they are symmetric with the assumed location of the ToM in the middle. We also recommend to include as many observations as possible in the interval. However, one has to avoid parts of the light curve showing "proximity effects" such as local minima or maxima (different from the minimum or maximum you are looking for). You can often recognize these effects as small 'humps' in the otherwise smooth ascending or descending branch of the light curve. In other words, there should be only one minimum or maximum in the marked interval.
- Then click the Find Extremum button
 in the ObsWin toolbar. Peranso will now start the Kwee-van Woerden calculation and will display an Extremum indicator at the location of the minimum. The Extremum indicator section explains how to read the ToM value. in the ObsWin toolbar. Peranso will now start the Kwee-van Woerden calculation and will display an Extremum indicator at the location of the minimum. The Extremum indicator section explains how to read the ToM value.
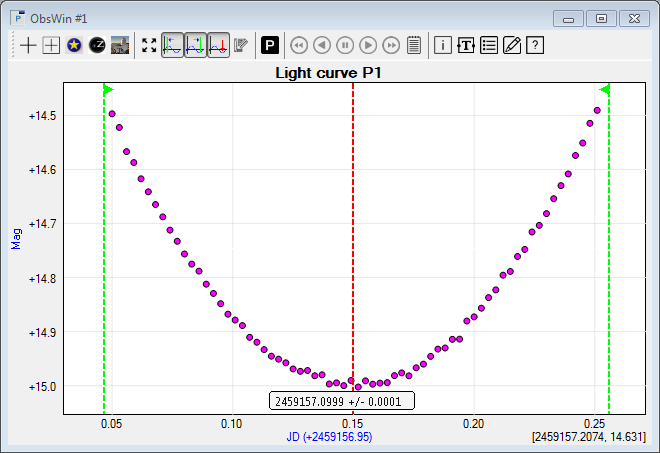
We obtain a measured ToM value of JD = 2,459,175.0999 +/- 0.00011. Note that the 'correct' ToM for this synthetic light curve is 2,459,157.1000. This is within the interval of our measured ToM, and hence a good result.
- Move the Left Margin cursor and Right Margin cursor closer to the minimum. The Extremum indicator disappears (as it is no longer valid for the newly marked interval). Click again the Find Extremum button, and verify that the measured ToM range still includes the correct ToM.
1Important remark
The calculated Kwee-van Woerden error almost always is smaller than in extremum calculations with other methods. It reflects the assumption of a perfect symmetrical light curve. In our experience, the Kwee-van Woerden error values are over-optimistic on most data sets we have analysed, although consistent with values reported by other software implementations of the Kwee-van Woerden method.
|