Extremum indicator
|
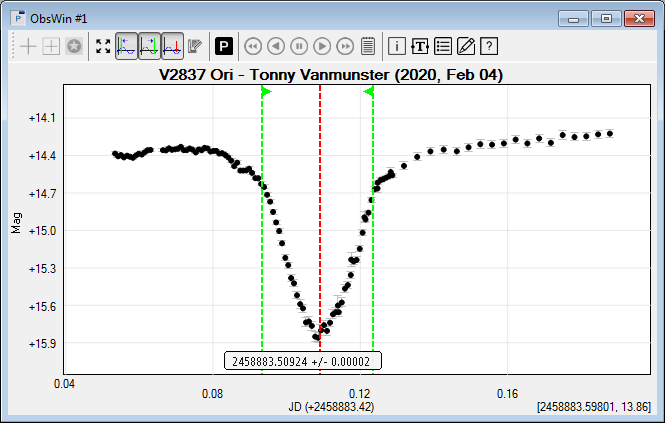
An Extremum Indicator is used to mark the position of an extremum (minimum or maximum) on the abscissa (X axis) of an Observations, Period or Phase Window. It is the result of a Kwee-van Woerden extremum calculation. When working with an Observations Window, an extremum indicator is also drawn to visualize a polynomial fit extremum. To modify the visual appearance of an Extremum Indicator, use the Properties dialog box. To copy the extremum value, shown in the Extremum Indicator label, to the Windows Clipboard, move the mouse over the center of the label and do a right mouse click. A pop-up menu will appear allowing you to copy the extremum value to the clipboard.
|