Residuals (CLEANest)
|
Residuals result from subtracting a Model function from the observations and are used to visualize how adequate one or more periods fit the observations. This overlay only exists for Observations windows analysed through the CLEANest period analysis method, and can be reached through the CLEANest Workbench. Residuals are explained in full detail as part of Tutorial 4 - Finding multiple periods using CLEANest.
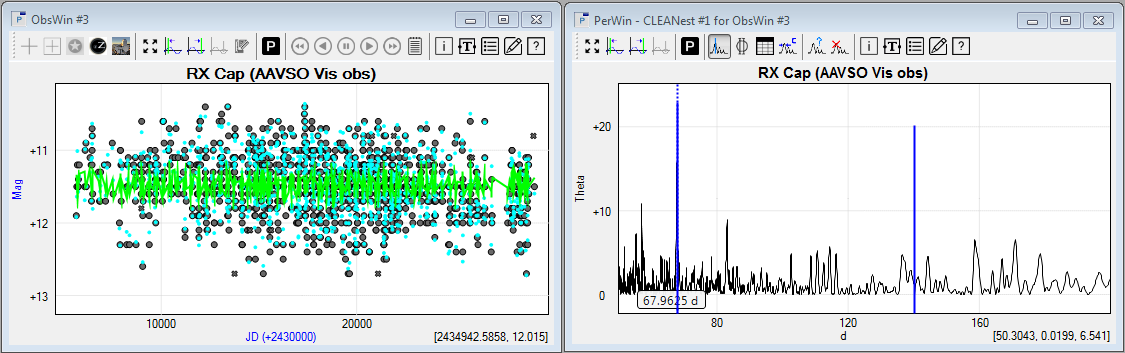
Left: ObsWin showing RX Cap AAVSO visual observations as gray dots. The cyan dots are the Residuals resulting from subtracting the CLEANest Model function, drawn in green, from the observations. Right: CLEANest PerWin with two Frequency cursors highlighting the two dominant periods. |