Polynomial fit
|
The Polynomial fit overlay is part of the Lightcurve Workbench and is explained in full detail in the corresponding section.
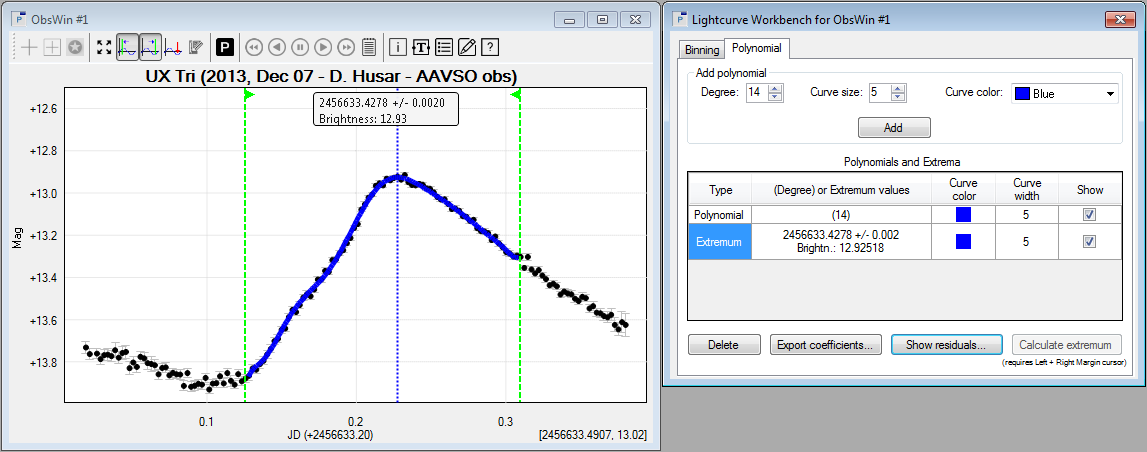
Observations of the RRab-type variable star UX Tri by Dieter Husar. The green dashed lines are Margin cursors. The blue solid line between both cursors is a 14-degree Polynomial fit, while the blue dotted vertical line is the polynomial extremum indicator, showing the time of maximum. To the right of the Observations Window is the Lightcurve Workbench. |