|
This section describes how to import observations from a DASCH text file. We will retrieve the archieval observations of the recurrent nova T CrB. The most recent nova eruption in T CrB happened in 1946. Comparing the optical light curve around 1946 with the one at the time of the prior eruption, in 1866, and with the light curve of recent years, it has been suggested1 that T CrB will again erupt in the next few years.
Downloading observations from the DASCH website
You can download files with DASCH observations from the DASCH website where you have to enter the J2000 coordinates or the appropriate name of the star in the large gray box, which you see above the word 'Source:".
- Let's enter T CrB in the gray search box and click the Search button, leaving other fields to their default values. A new webpage is displayed and might take some time to complete. Once done, you will see in the upper left box the words DASCH (atlas) Catalog Query Results and the ATLAS id of the found object, i.e. ATLAS2_825943803.
- Click on the ATLAS id. The corresponding light curve will be drawn at right. To ensure that observations of poor quality are filtered out, check that the button Show: All points is not pressed. If the label of the button appears in bold, it means the button is pressed.
- Below the light curve is a button Download data in tab-delimited or VOtable format, which you have to press. It brings you to a new webpage showing a table with the header DASCH Photometry Data for, followed by the ATLAS id of the object. Scroll down till you find the button Get plotted data (text file), which you have to click. It will download the light curve in a text file.
Importing the DASCH text file in Peranso
- Select Open in the File menu (or click on
 in the Desktop Toolbar) to display the File Open box. in the Desktop Toolbar) to display the File Open box.
- Navigate to the folder, which contains the downloaded text file. The file name starts with the words plotshort_ followed by the ATLAS id. If you don't see the file in the file selector, make sure that the file type selector in the lower right corner of the file selector either shows All files (*.*) or DASCH (*.txt). Select the file and click the Open button. In this tutorial, we already included an example DASCH text file for T CrB, which you will find in the Tutorials 12 folder. Open the file plotshort_ATLAS2_825943803.txt.
- This loads the contents of the file and creates a DASCH Observations Window (ObsWin).
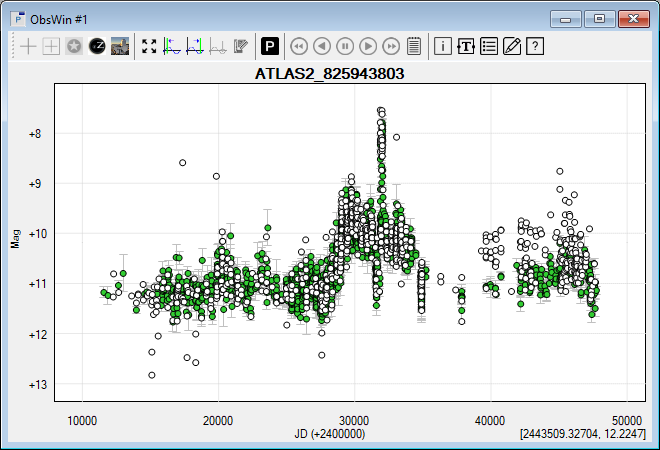
- Each DASCH ObsWin consists of two observation sets:
- An Observation Set with accepted observations, displayed as active observations and drawn by default in lime green color.
- An Observation Set with rejected observations, displayed as inactive observations drawn as open circles. Rejected observations are excluded from period analysis calculations.
The distinction between accepted and rejected observations is made through the settings used in step 2 above of Downloading observations from the DASCH website. If you revisit that webpage, you will notice that DASCH applies default settings to reject observations of bad quality (marked by the buttons with bold labels), such as observations with high astrometric error, plate defects, blending, saturated images, etc. They are marked in red color in the DASCH plot on that webpage, but as they are rejected for any further processing, Peranso rather displays them as inactive observations.
Note that there is no way to activate rejected DASCH observations in Peranso, to avoid you start including poor quality observations in your further analysis work.
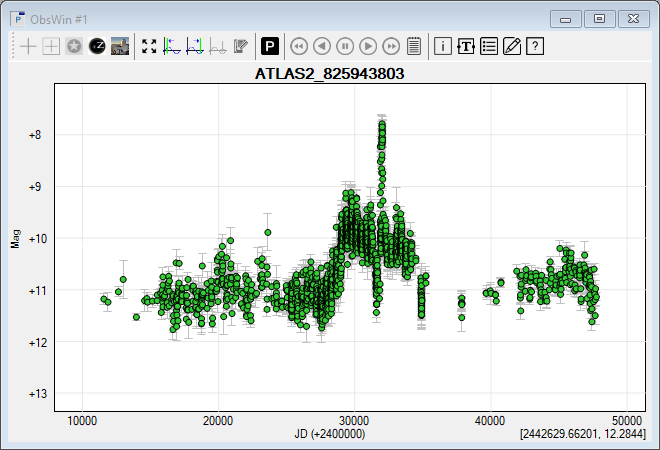
To avoid screen clutter caused by rejected observations, we recommend to use the ObsWin Properties dialog box and to select the Hide inactive observations option in the Form tab. Your ObsWin then will look as follows. Move the mouse cursor over the peak and you will immediately recognize the July 1946 eruption of T CrB.
Further processing of the DASCH Observations window
The DASCH catalog contains photographic plates made between roughly 1880 and 1990. Not all plates are of high quality, and we already saw in the previous step that a lot of observations have been rejected even before we created the ObsWin.
- In many cases it is important to do some further post processing on the remaining observations to further filter out poor quality data. To do so, we have to introduce two important DASCH concepts: AFLAGS and QFLAGS (Quality flags).
- AFLAGS: as part of the photometric pipeline process applied during the digitalization of DASCH plates, warnings are collected for each observation to describe a variety of issues encountered during the photometric reduction. Examples: star has a high background level, star is close to the limiting magnitude, non-stars, star is too low on the horizon, etc. These warnings are collected in the AFLAGS property of an observation. Peranso stores the AFLAGS settings of each DASCH observation.
- QFLAGS: are used to further eliminate outlier observations, and to ensure that only very good observations are finally retained. Each DASCH observation has a QFLAGS property that collects information about color terms, about the type of telescope used for obtaining the photometric plate (e.g., a narrow-field telescope, a wide-field patrol telescope), or about the usage of so called "Pickering wedges" producing artificial secondary stars near bright stars. Peranso collects the QFLAGS settings of each DASCH observation.
- AFLAGS and QFLAGS are a powerful mechanism to further remove poor quality observations from the ObsWin. To do so, right click in the plot area of the ObsWin to display the context menu. In there, select the entry DASCH activate/deactivate accepted observations. This displays the corresponding dialog box:
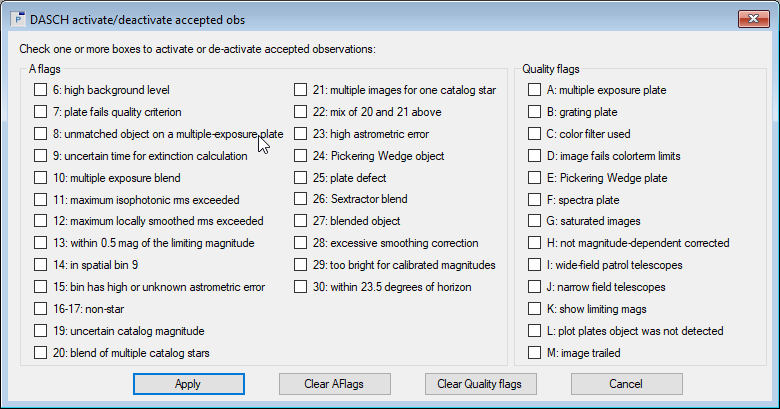
- The left hand side of the dialog box shows all available AFLAGS, labeled from 6 to 30, whereas the right hand side shows all available QFLAGS, labeled from A to M. Click (multiple) AFLAGS and QFLAGS to further filter observations, i.e. by selecting flags and subsequently clicking the Apply button, you will see that accepted observations turn inactive (and will become invisible if you have the Hide inactive observations option turned on). Hence, they will be excluded from your analysis work. As an example: select the QFLAG "G: Saturated images" and click Apply to de-activate observations that are part of saturated plates. Some of the flags may have no effect, as the corresponding observations have already been rejected by the default DASCH settings (see above).
Using the Clear AFlags and Clear Qualityflags buttons you can reset the flag selections in the dialog box.
- Move the mouse over an observation and you will notice that the callout box contains an additional entry at the bottom called A - Q Flags. The numbers and letters correspond to the numbers and letters used in the above dialog box.
- Click on these links for a full explanation of AFLAGS and QFLAGS values.
- Finally, you will notice that the last DASCH ObsWin observation was made in July 1989. To include more recent T CrB observations in your analysis, you can open a second ObsWin and download AAVSO observations of T CrB using the steps described in Tutorial 1. Then merge the observations from both ObsWins together and judge yourself if the pre-1946 light curve pattern indeed is showing some similarity with the light curve of recent years.
(1) See for instance the paper Increasing activity in T CrB suggests nova eruption is impending by Gerardo J.M. Luna et al.
|