|
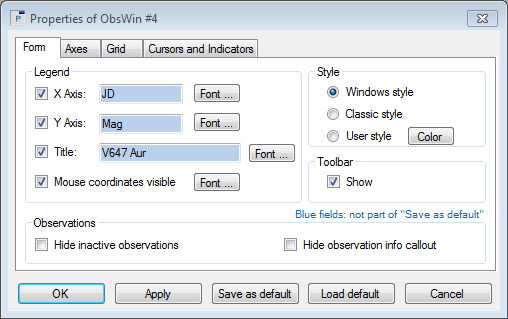
This tab contains 4 sections:
- Legend: defines the X Axis legend, Y Axis legend and title to appear in the Observations Window. Enter the legend in the text fields. To make the legend visible, click the check box in front of the legend. Use the Font button to modify the font properties of the legend (e.g., text height). Use the Mouse coordinates visible check box to control the visibility of the mouse coordinates, that appear in the lower right corner of the Observations Window. Likewise, the Font button is used to modify the font properties of the mouse label.
- Style: defines the background color of the Observations Window area that contains the title, X Axis legend, Y Axis legend, mouse coordinates, etc. One can choose amongst a Windows style (background color is the Microsoft Windows background color, usualy light gray), a Classic style (white background color), or User style, which lets you pick the desired color using the Color button.
- Toolbar: toggles the visibility of the Observations Window toolbar.
- Observations: if you enable the Hide inactive observations check box, only active observations will be drawn in the Observations Window. Use Hide observations info callout to avoid that the callout box appears when hoovering the mouse over an observation in an Observations window.
|