- The identification of outlier observations is done through the Lightcurve Workbench. Select Lightcurve Workbench in the Observations window menu (or click on
 in the ObsWin Toolbar). in the ObsWin Toolbar).
- Select the Outlier removal tab in the Lightcurve Workbench.

- We will focus on the first section, called Lowess fit. It uses the LOWESS1 technique to create a smooth line through the light curve, i.e. we will draw a line of 'best fit' through the observations. Later, we will see how this Lowess fit will be used to identify and remove outlier observations.
- The Lowess fit section consists of following fields:
- Smoothing amount: defines the level of smoothing you want to apply. Higher values will result in a flatter smooth line, while low values will produce a smooth line that fits as many observations as possible. Enter a value of 100 and press the Add smooth line button. A smoothed line in blue color appears in your ObsWin. Now press the Hide smooth line button to remove the smooth line. Enter a value of 15 and press Add smooth line again. You will now see a smooth line that runs through most of the observations in the light curve, including the outlier ones. This is an example of an "over-smoothed" fit.
- G: click the G (Guess) button to let Peranso propose a value for the Smoothing amount. This is a starting value - you may have to refine it depending on your particular light curve. If we click the G button, we will see that the Smoothing value becomes 49. Clicking the Add smooth line button then will result in the below fit.
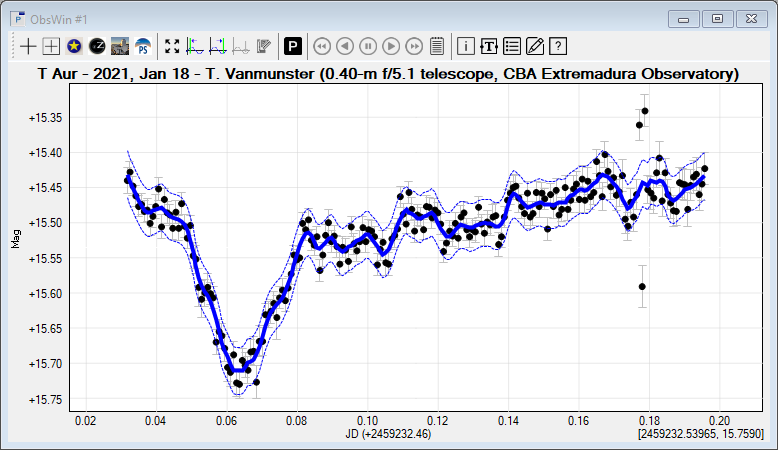
- Envelope width: when drawing the smooth line, you will notice that a thin dotted line appears above and below the smooth line, in the same color. These thin lines define an "envelope" (or area) around the smooth line, which will be considered as the area containing all valid observations. Observations outside of the envelope will be considered outliers. To make the envelop smaller, enter a low Envelope width value. It will result in more outliers. In the above example, we have used a width value of 11, producing a nice envelope.
- Curve size and curve color: define resp. the thickness and line color of the smooth line.
- Add smooth line: draws the smooth line including envelope through the observations. The label of the button changes to Hide smooth line once the smooth line has been drawn. Click this button to remove the smooth line. In addition, observations marked as outliers (see next section) will become regular observations again.
When working with large datasets, the LOWESS calculations will become more time consuming. In that case, a small progress bar appears in the dialog box to show the progress of computations. In addition the Cancel button will become active, allowing you to interrupt ongoing computations.
- Export weights and residuals: if you are only interested in computing the LOWESS fit through the light curve, and you want to know the weight and residual values resulting from the LOWESS calculations, then click the Export weights and residuals button to export these values to a text file.
- Detrend: creates a new Observations Window, which is a copy of the current Observations Window, but in which all observations have been detrended using the LOWESS Smoothing amount setting. This allows to flatten a light curve by removing long-term variability that we are not interested in. An example is given in the section Plotting a Kepler light curve.
In mathematical jargon :
1LOWESS (Locally-Weighted Scatterplot Smoothing) is a non-parametric regression method that essentially fits a unique linear regression for every observation, by including nearby observations to estimate the line slope and intercept. This is a robust technique because it performs residual-based reweightings by specifying the number of iterations to operate.
|