|
Finally, we will use the Outlier removal section to finish the identification and removal of outlier observations. This section consists of:
- Number of outliers in ObsWin: this label will display the total number of outlier observations present in the ObsWin. It becomes active when you press the Show outliers button.
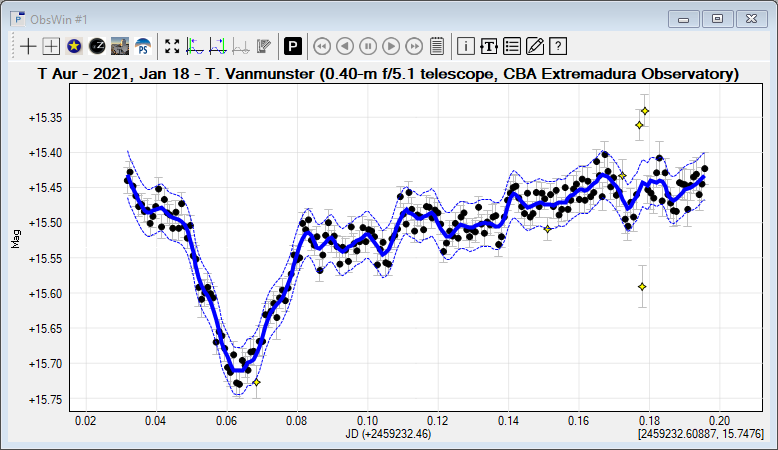
- Show outliers: pressing this button will graphically mark all outlier observations in the ObsWin. Outliers appear in bright yellow, making it easy to distinguish them from all other observations.
- Deactivate outliers: pressing this button will deactivate all outliers, which will exclude them from subsequent period analysis calculations. You can not undo this operation, unless you manually activate the observations again.
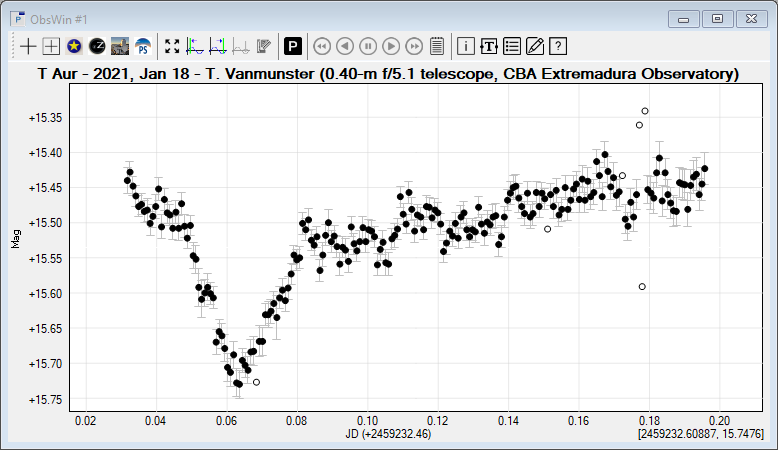
Our example light curve looks as follows after having deactivated all outlier observations:
Additional exercise
If you want to apply the outlier removal technique to a complex light curve, we recommend to open the T UMi light curve from Tutorial 5. This light curve contains 11,973 active observations and 861 fainter than observations. In addition, you will clearly notice that there are several outliers.
Use the above steps to produce an effective smooth line and envelope. Make sure to zoom in on the light curve when showing the detected outliers to judge if your selection was good. Finally, deactivate the outliers.
We obtained good results using a smoothing amount of 2 (using the Guess button) and an envelope width of 16. It resulted in the identification of 367 outliers.
|