- Select PhaseWin at Frequency cursor value in the Period analysis menu (or click
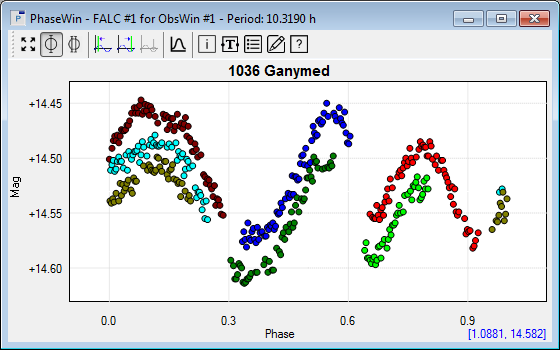
 in the PerWin toolbar). This creates a Phase Window (PhaseWin) showing the result of folding the 1036 Ganymed observations over the dominant period of 10.319 hours. in the PerWin toolbar). This creates a Phase Window (PhaseWin) showing the result of folding the 1036 Ganymed observations over the dominant period of 10.319 hours.
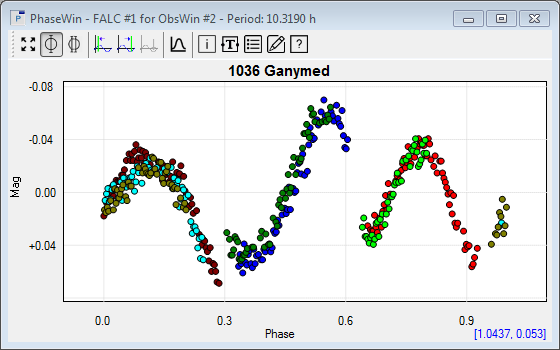
The PhaseWin is displaying the folded observations over a phase range from 0.0 to 2.0. It is common in asteroid light curve analysis to work with Single Phase views, ranging from 0.0 to 1.0. To switch to Single Phase view, click the  button in the PhaseWin toolbar. button in the PhaseWin toolbar.
The PhaseWin illustrates that all ObsSets have been well aligned and that the dominant period is nicely matching the observations.
- Select Info in the Phase window menu (or click
 in the PhaseWin toolbar) to display the Info box. It contains the regular Peranso info fields, complemented with some FALC specific fields, that indicate the number of harmonics and the default MagError values used during the calculations. It furthermore shows that the dominant period of 10.319 hours has an uncertainty of 0.002 hours. in the PhaseWin toolbar) to display the Info box. It contains the regular Peranso info fields, complemented with some FALC specific fields, that indicate the number of harmonics and the default MagError values used during the calculations. It furthermore shows that the dominant period of 10.319 hours has an uncertainty of 0.002 hours.
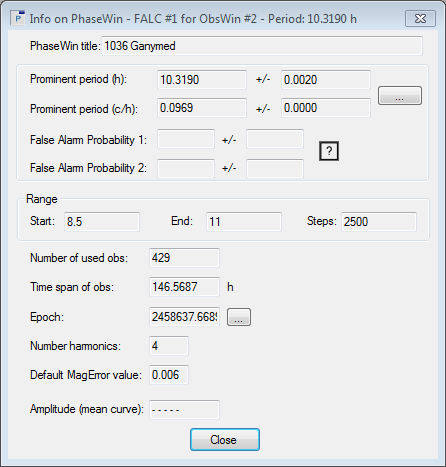
- Next to the Epoch field in the Info box is a button labeled "...". You may use this button to change the position of the 0% phase using the Epoch box. The Epoch box is explained in Tutorial 2.
Advanced exercise
Repeat all of what we so far have done in this tutorial starting from the original Observations Window containing the non-aligned Observation Sets. You will still find a dominant period at 10.319 hours. However, the Phase Window will show that the Observation Sets do not mesh well together; they are shifted. This is a good indication that a better alignment is needed.
|