Show / Hide EEBLS fit
|
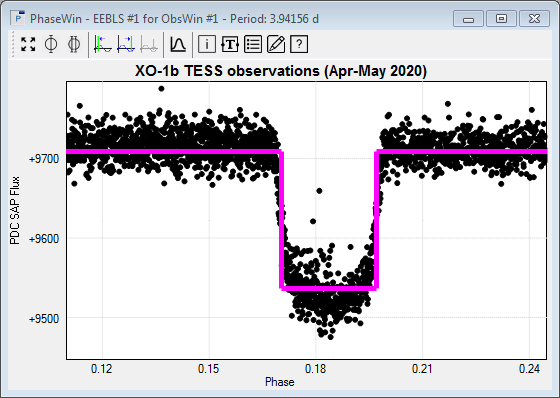
Select Show/hide EEBLS fit to graphically display an EEBLS fit in the Phase Window. Selecting the same entry again will hide the EEBLS fit. This menu entry is only available when performing an EEBLS period analysis. An example usage of an EEBLS fit is given in Tutorial 6.
|