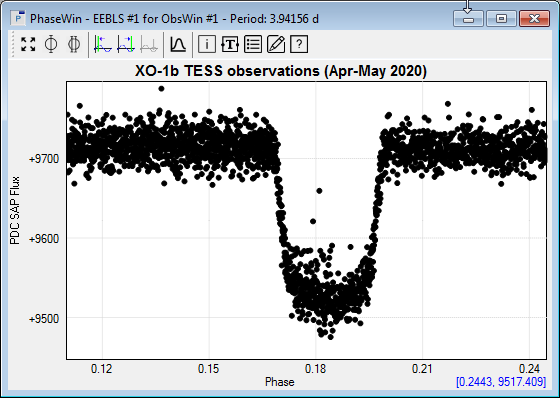
- Select PhaseWin at Frequency Cursor value in the Period analysis menu (or click on
 in the PerWin toolbar). This creates a Phase Window showing the result of folding the XO-1b time series data over the dominant period of 3.94156 d. Zoom in on the part of the PhaseWin showing the transit. in the PerWin toolbar). This creates a Phase Window showing the result of folding the XO-1b time series data over the dominant period of 3.94156 d. Zoom in on the part of the PhaseWin showing the transit.
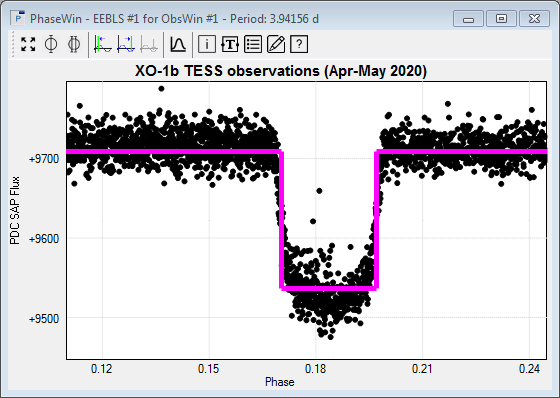
- Click the right mouse button anywhere in the plot area of the Phase Window to display a context menu. Select Show/hide EEBLS fit to graphically display the EEBLS fit in the PhaseWin. Selecting the same entry again will hide the EEBLS fit. Zoom in on the Phase Window to obtain a view similar to the one below.
- You can change the line color, thickness and style of the EEBLS fit using the Properties command of the PhaseWin, accessible from the same context menu as in previous step. The Cursors and Indicators tab of the Properties box has a Mean curve indicator section, which is used to control the size, style and color of the EEBLS fit.
Additional exercise
This tutorial contains another exoplanet transit light curve. Open the file OGLE-TR-111 Udalski. This light curve shows observations that are publicly available at The Optical Gravitational Lensing Experiment1 OGLE website.
Use the steps from this tutorial to find the transit characteristics of OGLE-TR-111. Good start and end values for your search range are 0.1 c/d and 0.9 c/d resp., again using 5000 steps and 1000 bins. You should find a transit period of 0.2490 +/- 0.0014 c/d, a transit depth of 0.0169 mag, a transit duration of 0.1538 d, and ingress and egress phase values of 0.9246 and 0.9520 resp.
(1) Udalski et al., Acta Astron. 52, 317, 2002.
|