- Zoom in on a random part of the detrended ObsWin. You will notice multiple dips in the light curve. Use the Measurement indicator to determine the distance between successive dips. You will notice they are approx. 0.8 days apart.
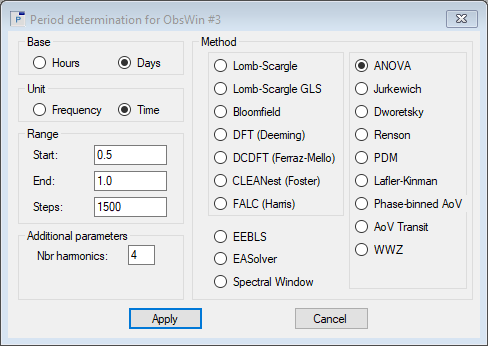
We will use an ANOVA period search and will look for periodicities in the range from 0.5 to 1.0 days with 1500 steps.
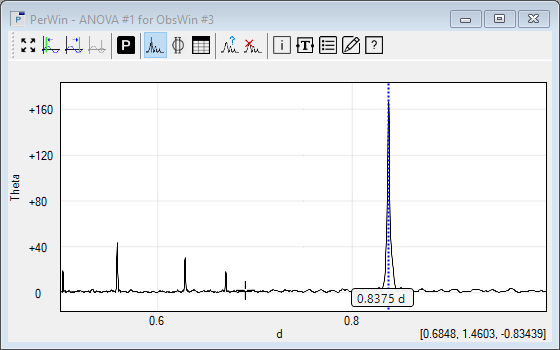
- The resulting PerWin shows a dominant peak at 0.8375 days, which is in perfect agreement with the orbital period value mentioned above. Hence, it seems we have recovered the orbital period of Kepler-10b.
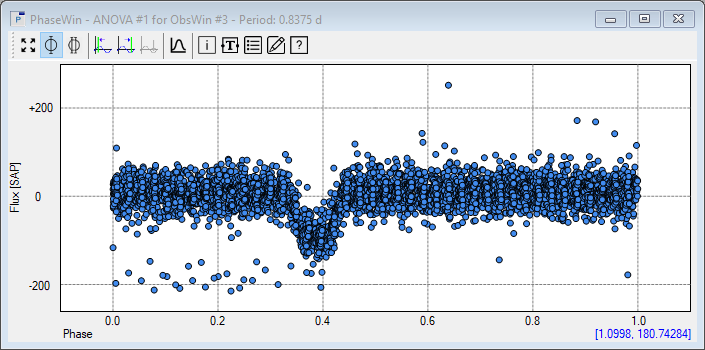
- Finally, let's have a look at the PhaseWin, selecting the Single Phase View option. It displays the below phase diagram, in which the dip, produced by the Kepler-10b exoplanet transit, is clearly visible.
Additional exercise
Use the Kepler datasets selector to select a few other random datasets. You will notice that it's rather easy to also recover exoplanet Kepler-10b in these datasets.
|