- Select New in the File menu (or click on
 in the main Toolbar) to open a new Observations Window (ObsWin). This brings up an empty ObsWin in the Peranso Desktop. in the main Toolbar) to open a new Observations Window (ObsWin). This brings up an empty ObsWin in the Peranso Desktop.
- The toolbar of the ObsWin contains several buttons. Click on
 (Add Internet light curve). This brings up a menu. Select the (Add Internet light curve). This brings up a menu. Select the  ZTF light curve entry to display the below dialog box. ZTF light curve entry to display the below dialog box.
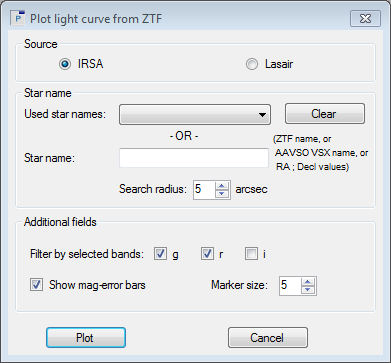
- This dialog box contains 3 sections: Source, Star name and Additional fields:
- The Source section gives you the option to plot ZTF light curves either from the NASA IRSA archive or from the Lasair broker. Both sources are explained in the ZTF Glossary section. IRSA provides archival data of ZTF, so not the latest observations, whereas Lasair provides nearly instant access to also the most recent ZTF observations. However, our experience tells that the IRSA ZTF observations generally are of higher quality than the Lasair ZTF data. Hence, depending on the type of information you are looking for, you will have to select between both sources.
- In the Star name section, there's an empty field labeled Star name. You can enter Star names in 4 ways:
- If you know the ZTF name of the object, you can enter it here. ZTF uses a specific designation for each object, as indicated by this example: ZTF18abomvcg
- You can also enter the AAVSO VSX or SIMBAD name of the object, e.g. V0495 Cas
- Or its (J2000.0) RA and Decl coordinates. Both values have to be separated with a semi-colon. RA and Decl need to be in sexagesimal format with values separated by spaces. So, a valid entry would be: 02 46 16.05; +62 17 03.4
- Or its (J2000.0) RA and Decl coordinates, expressed in degrees and separated with a semi-colon. Example: 76.80654; -69.595361
The Search radius field allows to specify the radius of a circular search area centered around the position of Star name.
The field Used star names recalls the Star name you entered for each successful ZTF search. It makes it more convenient to repeat searches in the future. Click the Clear button to erase all entries in the Used star names field.
- The Additional fields section differs between IRSA and Lasair plots. This is explained in more detail below.
- Peranso by default colors g-band observations in green and r-band observations in red, using the same convention as ZTF. Observations in i-band are colored in blue. All observations belonging to the same band will be grouped in one Observation set.
- If you hover the mouse over an observation, you will see that the mouse coordinates in the lower right corner of the Observations Window become highlighted (bold) and show one additional field, which displays the used ZTF band.
Plotting ZTF observations from NASA IRSA
When selecting IRSA as Source, the Additional fields section provides following options:
- Filter by selected bands: we can select if we want to retrieve g-band, r-band or i-band ZTF observations, or any combination.
- If ZTF observations have a brightness error, Peranso will display error bars to denote the error region. The default behavior of Peranso is to display error bars, unless you deselect the Show mag-error bars box.
- Finally, the Marker size defines the size of the dots used for drawing the observations. Each dot represents one observation, and is drawn in the color of the band (filter) in which the observation was made.
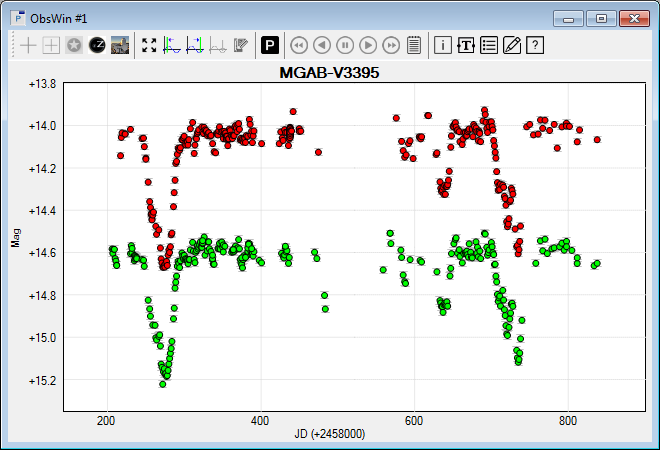
- As an example, let's plot a ZTF IRSA light curve for the variable star MGAB-V3395. This is a suspected eclipsing Young Stellar Object (YSO1), located in the Dolidze 40 open cluster. It was discovered by Gabriel Murawski. A complex eclipse observed in 2019 suggests the presence of a circumstellar disk. You will recognize that eclipse in your ZTF IRSA light curve, together with an other eclipse in 2018.
- We enter MGAB-V3395 in the Star name field and select the g and r bands, and we select a Search radius of 3 arcsec. Then press Plot. You will get the following ObsWin:
(1) If you have interest in observing YSO's as part of a pro-am collaboration network, we recommend joining the HOYS-CAPS initiative.
Plotting ZTF observations from Lasair
When selecting Lasair as Source, the Additional fields section provides following options:
- A ZTF magnitude is either expressed as a Difference magnitude or Apparent magnitude:
- Difference magnitude: ZTF photometry is measured after subtraction of a template image. Reported magnitudes correspond to the difference in flux with respect to the template. Positive differences are displayed in Peranso as solid circles, while negative differences are shown a solid squares.
- Apparent magnitude: in addition to difference magnitudes, Lasair also computes apparent magnitudes. It is a re-engineered magnitude, requiring the zero point of the science image, which ZTF did not make available before Nov 2018. Therefore the apparent magnitudes are NOT reliable before this date.
- Filter by selected bands: we can select if we want to retrieve g-band or r-band ZTF observations, or both.
- If ZTF observations have a brightness error, Peranso will display error bars to denote the error region. The default behavior of Peranso is to display error bars, unless you deselect the Show mag-error bars box.
- Finally, the Marker size defines the size of the dots used for drawing the observations. Each dot represents one observation, and is drawn in the color of the band (filter) in which the observation was made.
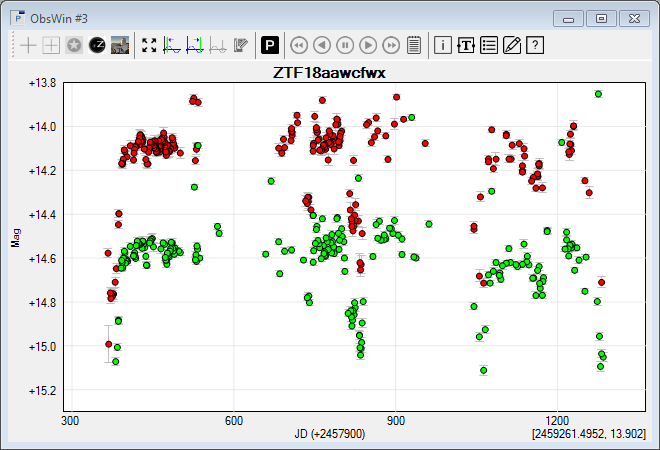
- Create another new ObsWin, and select the Add ZTF light curve icon. We will now plot the ZTF Lasair light curve of MGAB-V3395, using also a Search radius of 3 arcsec, in g-band and r-band, and using Apparent magnitudes.
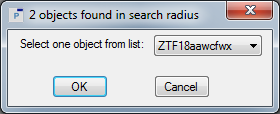
- Peranso will inform you that 4 ZTF objects where found in the search radius, and will offer you a selection box in which you have to pick the first one ZTF18aawcfwx. The object names use the ZTF naming convention. Click OK.
- This creates the below ObsWin, in which we have zoomed in on the part of the light curve that covers a similar magnitude range as the ZTF IRSA light curve. Notice some striking differences between both ObsWins. The IRSA one covers a smaller time range (remember, these are archival observations), whereas the Lasair one runs till 2020, Dec 01, the creation date of the ObsWin. The quality of the IRSA ZTF observations is higher than the Lasair ZTF observations.
- If you have no internet connection, you can access the above ObsWins as follows: select Open in the File menu to display the File Open box. Navigate to the Peranso Tutorials 10 folder. To do so, first locate your My Documents folder (typically C:\Users\<your_user_name>\Documents). In there is a subfolder Peranso, then select the subfolder Tutorials. Select the folder 10. One-step light curve plotting. Select the subfolder Plotting a ZTF light curve, select the file MGAB-V3395 and click the Open button.
|