11. Plotting a light curve from the Windows clipboard
|
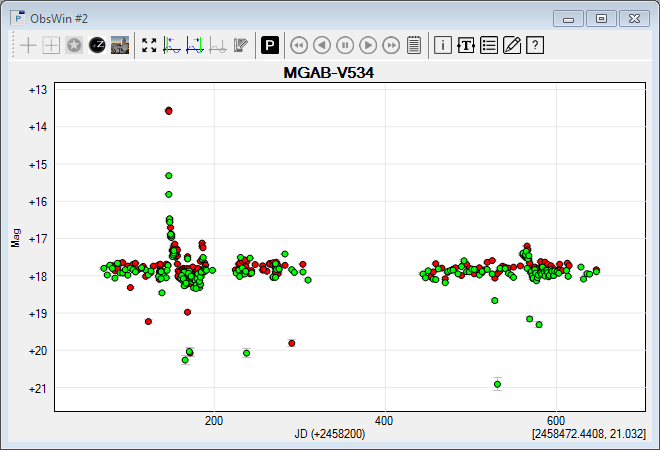
Peranso offers a wide variety of options for importing observations: either directly from an Internet source (see Tutorial 10. One-step light curve plotting), or by importing observations from a text file (see Tutorial 12. Importing a light curve from file). If you have observations from still a different source, you can still import them in Peranso using the Windows clipboard. This tutorial requires an active internet connection. The example in the next section is based on the variable star MGAB-V534. This variable was discovered by Gabriel Murawski in 2019 through ZTF data mining. It is classified as a possible eclipsing SU UMa-type1 cataclysmic variable in the AAVSO VSX. It was also found in bright outburst by ASAS-SN on Sep 26th, 2019 when it reached mag V/g 13.74. Use Tutorial 10. One-step light curve plotting to build a ZTF light curve of MGAB-V534, based on the IRSA archive. You should get the below ObsWin, showing an historical outburst of this variable in August 2018, when it reached mag r = 15.591. In the next section, we will download 8.3 years of observations by the Catalina Sky Survey (CSS), obtained between 2005 and 2013, to see if MGAB-V534 was in outburst on CSS images anywhere during this interval.
(1) SU UMa-type cataclysmic variables ("UGSU" stars) are characterized by the presence of two types of outbursts, called 'normal' and 'superoutburst'. During a superoutburst, the light curve shows periodic oscillations (superhumps), with a period close to the orbital period of the cataclysmic variable. |