- Select New in the File menu (or click on
 in the main Toolbar) to open a new Observations Window (ObsWin). This brings up an empty ObsWin in the Peranso Desktop. in the main Toolbar) to open a new Observations Window (ObsWin). This brings up an empty ObsWin in the Peranso Desktop.
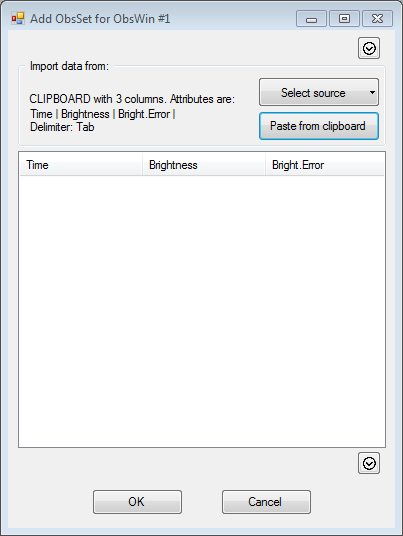
- Select Add Observation Set in the Observations window menu (or click on
 in the ObsWin toolbar) to display the Add ObsSet dialog box. It is used to create a new ObsSet and to add it to the ObsWin. in the ObsWin toolbar) to display the Add ObsSet dialog box. It is used to create a new ObsSet and to add it to the ObsWin.

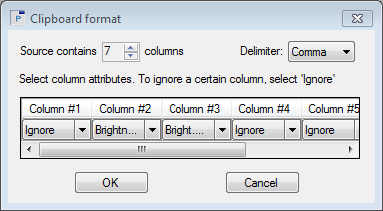
- Click on the small triangle of the Select source button in the Import data from section. It allows you to either use the Clipboard or a File as import mechanism. Click on Clipboard which brings up the Clipboard format dialog box.

- To paste the Windows clipboard contents to Peranso, we first have to describe the format or structure of the data in the Windows clipboard. We know from the comment line of the previous section, that each line in the downloaded Catalina CRTS file has the format "MasterID,Mag,Magerr,RA,Dec,MJD,Blend". This tells us that:
- There are 7 columns in the clipboard
- They are comma separated
- The first column is MasterID. This is a unique survey identifier given by CSS. We don't need it, so we will ignore the first column
- The second column is the magnitude or brightness
- The third column is the magnitude error or brightness error
- The fourth and fifth column are the RA and Dec coordinates. We will ignore both columns
- The sixth column is the Modified Julian Date (which is JD - 2,400,000.5). This is the time of the observation
- The seventh column indicates if the CSS image was impacted by blending. We will ignore this column.
- We will now configure the Clipboard format box according to the above info. First, we set the Source contains field to 7 columns. For Delimiter we select Comma. You will now see a row with 7 columns, labeled Column #1, Column #2, etc. This the column attributes part in which you have to indicate for each column what type of information it contains. Column #1 contains the MasterID, which we will ignore, so we select Ignore as attribute for this column. Column #2 contains the magnitude, so we select Brightness as attribute. Next, we select Bright. Error. For the fourth and fifth column we select Ignore. The 6th column is the MJD column, so we select Time. The last column again has to be Ignored. Your box should look like the screenshot above.
- You have to select the right Delimiter value. If you copy/paste contents from Excel, you have to know that Excel actually has replaced all comma's by Tab's while importing the file contents. Hence, in this case you have to set the Delimiter to Tab. But, if you opened the .csv file with a text editor instead of Excel, you will see that the .csv file uses comma's to separate columns. Hence, in this case you have to set the Delimiter to Comma.
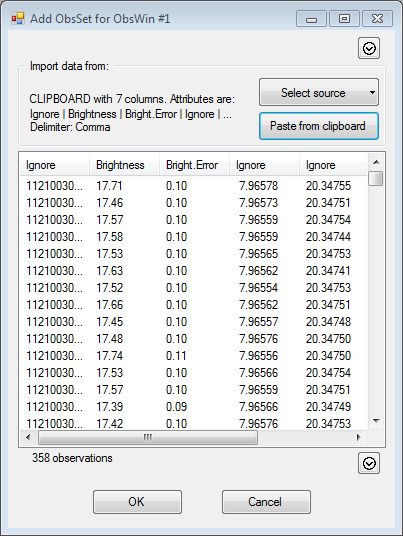
- Click the OK button to bring you back to the Add ObsSet dialog box. Note that the Import data from section gives a textual description of the currently active data source, i.e. "CLIPBOARD with 7 columns. Attributes are: Ignore | Brightness | Bright.Error | Ignore | .... Delimiter: Comma". [If you work through Excel, you will see Tab instead of Comma]
- Click the Paste from clipboard button to transfer the contents of the clipboard to the Add ObsSet dialog box. A total of 358 CRTS observations have been pasted.

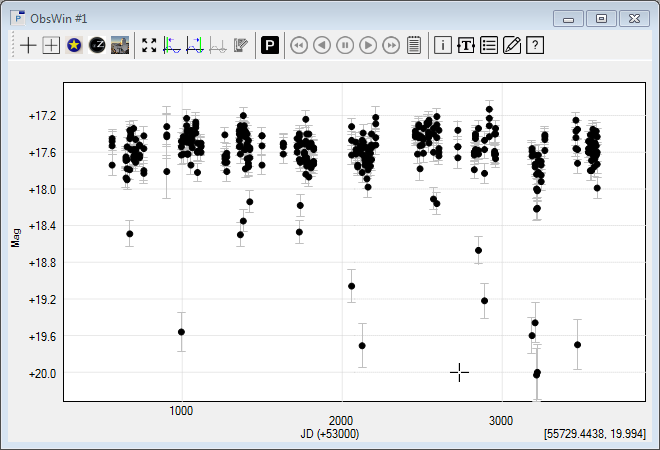
- Finally, click OK to transfer the MGAB-V534 observations to the ObsWin, which shows the CRTS light curve covering a span of 8.3 years.

- As you can see, there are no outbursts of MGAB-V534 in the above CRTS light curve. There are of course many gaps in the light curve, so we can't exclude that one or more outbursts have been missed. However, the light curve clearly shows a number of observations in the mag 18 - 20 range, similar to what we can see in the ZTF IRSA light curve of MGAB-V534 at the introduction of this tutorial. They are most likely explained as eclipses. Hence, there is good reason to assume that MGAB-V534 indeed is an eclipsing UGSU star.
|