|
In Step 4 of the previous section of this tutorial, we tried to use the mouse cursor to get a rough idea of how the period of T UMi has been evolving over time. Peranso offers a much more powerful mechanism for this. Each WWZ Period Windows allows to create two more specific Period Windows, directly derived from the WWZ Period Window:
- A Period Window showing how the Period evolves over Time
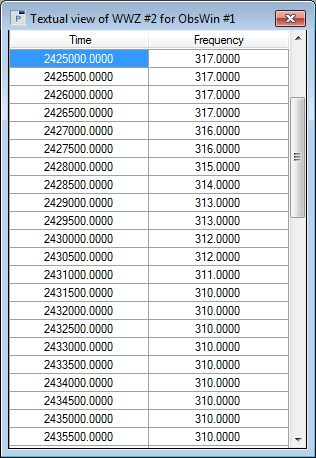
- A Period Window showing how the Frequency evolves over Time
- Move the mouse over the WWZ PerWin plot area and click right. In the popup menu select Time vs Period window (max WWZ). The newly created PerWin shows the evolution over time of the period of T UMi at maximum WWZ value, which corresponds with the 'dominant' section of the color map from previous section.

- To get a textual view of this Time vs Period window, click the Textual View button
 in the toolbar of the above PerWin. The combined PerWin and textual view provide a good instrument to study the period evolution in T UMi in further detail. in the toolbar of the above PerWin. The combined PerWin and textual view provide a good instrument to study the period evolution in T UMi in further detail.
|