


Copyright © 2022 - CBABelgium.com. All rights reserved

Peranso

Light Curve and Period Analysis Software
•
Directly plot light curves from the AAVSO database
This function allows you to populate an Observations Window with observations that are online retrieved from the AAVSO international database. You simply enter the name of the variable and the data range for which you want to retrieve observations. Click the Plot button, and the observations will be instantaneously downloaded and displayed. You can apply several filters before downloading observations, if needed. The speed and convenience to download and subsequently manipulate observations is tremendously higher than what the AAVSO LCG and AAVSO Vstar tools offer.
This function allows you to populate an Observations Window with observations that are online retrieved from the AAVSO international database. You simply enter the name of the variable and the data range for which you want to retrieve observations. Click the Plot button, and the observations will be instantaneously downloaded and displayed. You can apply several filters before downloading observations, if needed. The speed and convenience to download and subsequently manipulate observations is tremendously higher than what the AAVSO LCG and AAVSO Vstar tools offer.

•
Natively import observations from several sources
When plotting an Observations Window, you can natively plot light curves from several sources. We support the AAVSO Extended File Format EFF, the AAVSO International Database AID, AIP4Win 2.x AAVSO, ASAS, ASASSN csv, Lesve Photometry CBA and Lesve Photometry AAVSO file formats. In addition, you can copy/paste observations directly from your Clipboard, which is very convenient to import f.i. observations from an Excel file.
New as well is the ability to copy observations between Observation Windows, and to import observations from another Observation Window.
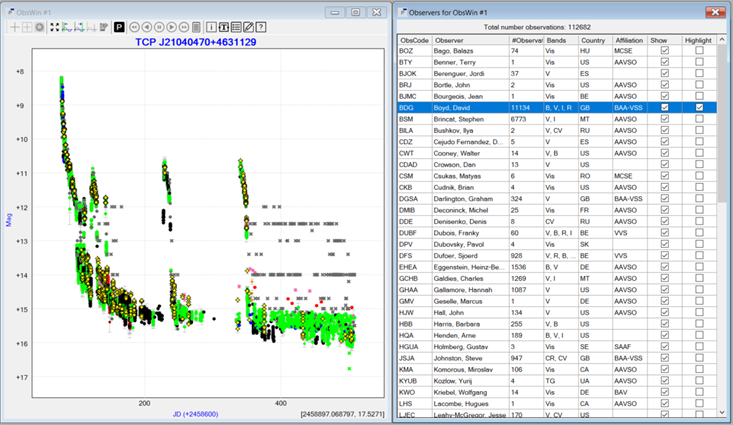
In addition, you can easily generate a list of all observers, who contributed to the light curve, showing their affiliation, number of contributed observations, used filters, etc. An “highlight” toggle allows you to visualize the observations contributed by one (or more) individual observers, as illustrated in the screenshot below. A "band selector" allows you to toggle observations based on their filter - you can select from 40 different filters, including U, B, V, R, I, Vis, CV, ...
•
New and improved Period Determination methods
Peranso 2.x already had an extremely rich set of Period Determination methods, all of which continue to be available in Peranso 3.0. We have even further enriched Peranso 3.0 with two new methods: Generalized Lomb-Scargle and WWZ (Weighted Wavelet Z-transform).
Compared to the conventional Lomb-Scargle periodogram, the Generalized Lomb-Scargle is superior as it provides more accurate frequencies, is less susceptible to aliasing, and gives a much better determination of the spectral intensity. Peranso 3.0 furthermore displays the 1%, 5% and 10% False Alarm Probabilty (FAP) limits in each Generalized Lomb-Scargle Period Window, as shown in the below picture.
.

The WWZ Weighted Wavelet Z-transform Period method uses wavelets to perform period analysis. This is a particularly effective method to detect and visualize period changes in time series. Peranso 3.0 uses an implementation based on the work of Grant Foster. Our WWZ Period Windows offer a great flexibility in manipulating the WWZ periodogram, changing the color map, plotting Time versus Period or Time versus Frequency plots, etc.

The CLEANest period determination method has a new Workbench tool, which now allows you to search for multi periodic signals in time series in a fully automated manner. You just enter the number of periods to be searched for, and all subsequent calculations happen without further user interaction.
•
Several improvements to Observations, Period and Phase Windows
Observations Windows have been extended with several new capabilities. For instance, to easily browse through light curves, a user can now turn on scroll buttons inside the Observations Window, allowing to pan the light curve, as illustrated by the screenshot below.
All titles and labels in an Observations Window, Period Window and Phase Window can be customized by the user, including the drawing font, color and size.
When hoovering the mouse over an observation in an Observations Window, a call-out box shows up with relevant information about the observation, including the time (Julian and Calendar Dates), brightness, used Filter, observer name (if available), etc.
Calculating and drawing Period windows has become significantly faster compared to Peranso 2.x, using some novel techniques. Compute-intensive operations, such as a Significance Analysis easily required 30 minutes or more to complete in Peranso 2.x. They now on average complete in less than 30 seconds.

•
Seemless integration with LesvePhotometry
LesvePhotometry undoubtedly is the most powerful CCD photometry package on the market and gaining momentum. It produces photometric reduction files in a/o the AAVSO file format (allowing you to directly upload your observations to the AAVSO International database), and in the CBA (Center for Backyard Astrophysics) format.
Peranso 3.0 offers seemless integration with LesvePhotometry (LP). It not only allows you to directly plot a light curve from a LP AAVSO or CBA data file, but you can also clean your LP data files by graphically marking incorrect observations in an Observations Window. Once you have marked all incorrect observations, a single mouse click will update the LP AAVSO or CBA data file and remove the corresponding observations from the file.
•
Easily visualize light curves with several hundred thousand of observations
While most day-to-day light curves of variable stars contain maximum a few thousand of observations, particular projects and especially space-based observations (e.g., TESS) may result in several hundred thousand of observations. This creates huge challenges in drawing light curves while preserving user interactivity. Peranso 3.0 uses an innovative drawing technique to optimize the amount of observations to be drawn at any given moment, while still preserving the overall shape and characteristics of the light curve. You can of course opt to turn of this optimization, in which case you can still handle all observations, but with decreased responsiveness.
The screenshot below shows a light curve of SS Cyg, retrieved from the AAVSO database, with over 605.000 observations. Using a low-end laptop, it takes less than a second to draw the entire light curve, and to zoom in on any particular section.

•
Ephemeris Calculator
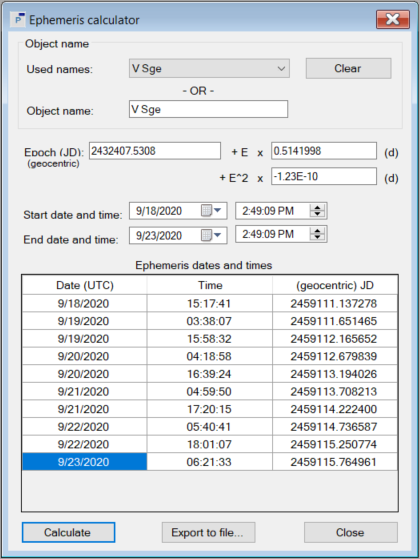
This convenient tool generates an ephemeris for exoplanet transit times, or for variable star eclipse times. Simply enter the name of the object, the epoch data and the observing interval, and you will get the list of all ephemeris dates and times, expressed in Julian Date and Calendar Date formats.
You have to enter the epoch data only once, as Peranso will remember this information for any object you entered. To re-use the information later on, you simply select the object name from a drop down list to generate a new ephemeris.
•
And many more novel features
Peranso 3.0 includes an email utility to send LesvePhotometry AAVSO or CBA observations directly to one or more recipients, by simply clicking on the light curve and by picking the email operation.
Peranso 3.0 offers full compatibility with Peranso 2.x: all of your Peranso 2.x files will open in Peranso 3.0 and render correctly, without loss of any data. New Peranso 3.0 files are written in XML format.
And there's more to come ...