Trendline indicator
|
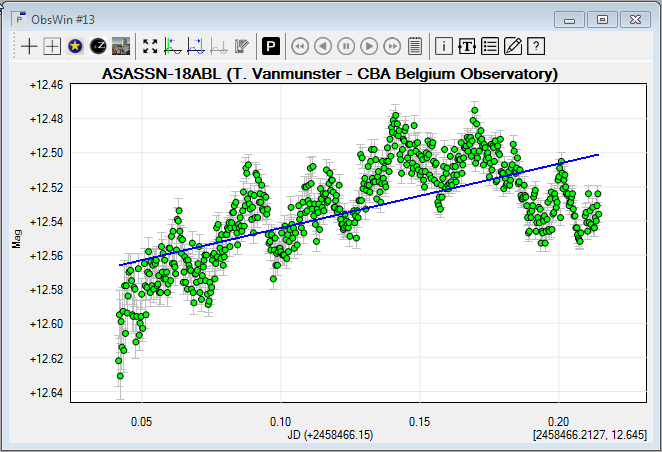
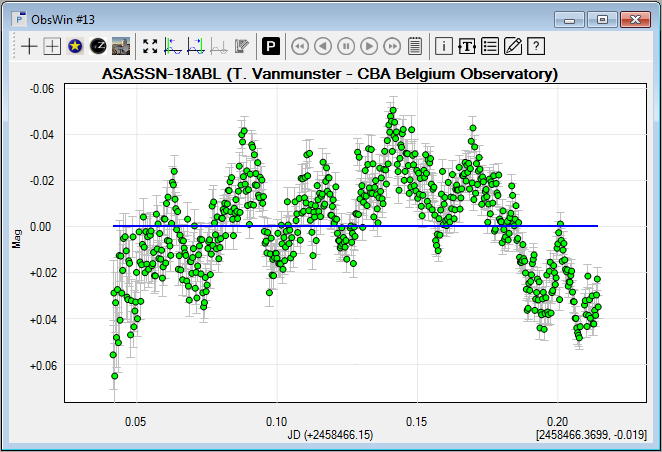
A Trendline indicator is used to visualize a linear fit - based on the least squares method - through all observations of an Observations Window. After visualizing the trendline, you may want to detrend the observations. To modify the visual appearance of a Trendline indicator, use the Properties dialog box of the ObsWin.
|