- Select New in the File menu (or click on
 in the main Toolbar) to open a new Observations Window (ObsWin). This brings up an empty ObsWin in the Peranso Desktop. in the main Toolbar) to open a new Observations Window (ObsWin). This brings up an empty ObsWin in the Peranso Desktop.
- The toolbar of the ObsWin contains several buttons. Click on
 (Add Internet light curve). This brings up a menu. Select the (Add Internet light curve). This brings up a menu. Select the  ASAS-3 light curve entry to display the below dialog box. ASAS-3 light curve entry to display the below dialog box.
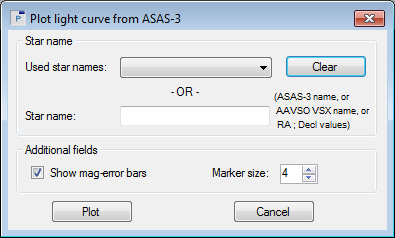
- This dialog box contains 2 sections: Star name and Additional fields:
- In the Star name section, there's an empty field labeled Star name. You can enter Star names in 4 ways:
- If you know the ASAS name of the object, you can enter it here. ASAS uses a designation for each object that incorporates the RA and Decl coordinates of the object, as indicated by this example: 045914-6935.8
- You can also enter the AAVSO VSX or SIMBAD name of the object, e.g. XX Dor
- Or its (J2000.0) RA and Decl coordinates. Both values have to be separated with a semi-colon. RA and Decl need to be in sexagesimal format with values separated by spaces. So, a valid entry would be: 04 59 13.57; -69 35 43.3
- Or its (J2000.0) RA and Decl coordinates, expressed in degrees and separated with a semi-colon. Example: 76.80654; -69.595361
The field Used star names recalls the Star name you entered for each successful ASAS search. It makes it more convenient to repeat searches in the future. Click the Clear button to erase all entries in the Used star names field.
- The Additional fields section has two fields:
- If ASAS observations have a brightness error, Peranso will display error bars to denote the error region. The default behavior of Peranso is to display error bars, unless you deselect the Show mag-error bars box.
- Finally, the Marker size defines the size of the dots used for drawing the observations. Each dot represents one observation.
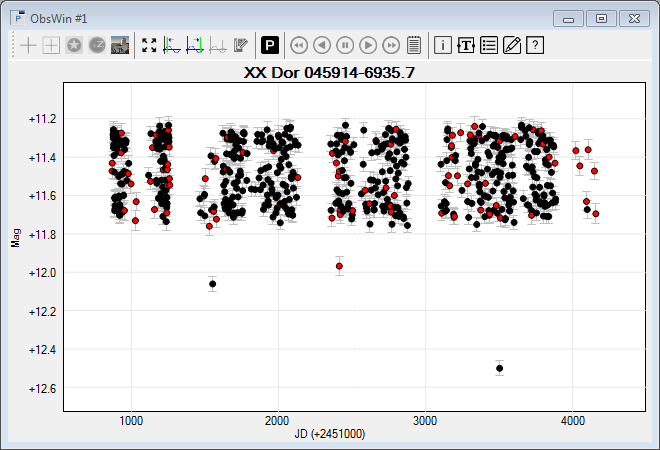
- As an example, let's plot an ASAS light curve of the variable star XX Dor. This is an RR Lyrae variable, more specifically an RRC one. RR Lyrae stars are commonly found in globular clusters and allow to measure galactic distances. They are pulsating stars.
We enter XX Dor in the Star name field and press Plot. You will get the following ObsWin, in which the title consists of the Star name followed by the ASAS designation:
- Move the mouse cursor over the plot area of the ObsWin and click the right mouse button. This brings up a context menu. Select ASAS Grade and Aperture selector, which displays the corresponding box.
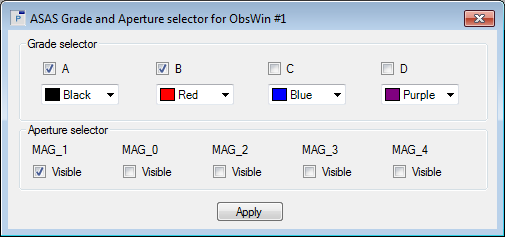
- The Grade and Aperture concepts are explained in the ASAS Glossary section. In short:
- Grade: is a quality indicator, going from A (best quality), B (medium quality), C (bad quality), to D (worst quality, probably useless). Peranso by default plots ASAS observations of grade A and B, but you can decide to plot other grades as well.
- Aperture magnitude: ASAS works with 5 apertures per exposure: 2, 3, 4, 5 and 6 pixels wide. Magnitudes obtained with the smallest aperture (2 pixels wide) are called MAG_0 magnitudes. MAG_4 magnitudes use the largest aperture (6 pixels wide). Peranso let's you select which aperture(s) to plot. Use small apertures for faint stars and larger ones for brighter stars.
- Peranso uses a different color notation than ASAS for plotting light curves. The color of a Peranso ASAS observation is determined by the Grade of that observation. This allows to easily differentiate between high quality and low(er) quality ASAS observations. In the above ObsWin, we plotted Grade A (black) and Grade B (red) observations.
Select the two other grades C and D and then press the Apply button. A few additional observations will now appear in the ObsWin. Likewise, you can look at the effect of the Aperture selector. All ASAS observations are kept in one Observation set.
- If you hover the mouse over an observation, you will see that the mouse coordinates in the lower right corner of the Observations Window become highlighted (bold) and show two additional fields, the Aperture and Grade values of the observation.
- If you have no internet connection, you can access the above ObsWins as follows: select Open in the File menu to display the File Open box. Navigate to the Peranso Tutorials 10 folder. To do so, first locate your My Documents folder (typically C:\Users\<your_user_name>\Documents). In there is a subfolder Peranso, then select the subfolder Tutorials. Select the folder 10. One-step light curve plotting. Select the subfolder Plotting an ASAS-3 light curve, select the file XX Dor and click the Open button.
|