Fit mean curve
|
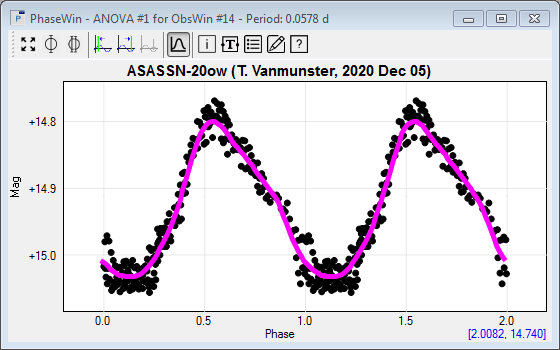
Calculates the mean curve of all phase data in the Phase Window, using a spline interpolation method. A user can modify the visual appearance of the mean curve using the Properties dialog box. The actual curve fit parameters, which define the fitting characteristics1 of the mean curve, are defined in the Windows tab of the Settings form, which is accessible from the File menu.There are 2 parameters: the Nbr bins (Nb) and Nbr covers (Nc). Higher values produce better and smoother fits.
(1) Technically: The PhaseWin observations are divided in Nb bins of length 1/Nb and we apply this partition Nc times, with each partition shifted over 1/NbNc |