Aliasing
|
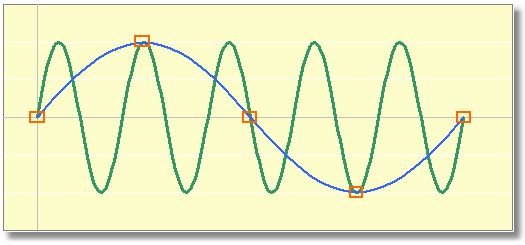
An alias for a period causes false peaks in the Period Window, which are artifacts of the interval between observations (the 'sampling rate'). An alias masquerades as another period, where the data seemingly fits as well as the correct period. It differs from the true period by an integral fraction, e.g., 5/2, 1/6, etc. This often happens if a single observation session does not cover a complete cycle of the variable or asteroid, and if the next run, also incomplete, is many cycles removed. Aliases are quite common in astronomical time-series. E.g., assume a variable star with a period of 0.8 days (green curve below). You make observations each consecutive night at almost exactly the same time (orange boxes). If you do a period analysis on your observations, you will find a peak (a/o) at 4 days, but this is not the result of the star varying on a 4 day period. It is the result of a sine wave (blue curve) that fits your observations.
The Peranso Spectral Window command calculates the pattern caused by aliasing. It displays not a true Fourier spectrum for a star, but indicates what peaks are artifacts of your sampling. It is typically used in combination with any of the regular period analysis methods, and is used to demonstrate that the period found can not be the result of the data sampling. One way to avoid aliasing is to ensure that your observation rate ('sampling rate') is "sufficiently" high. Always estimate the time between observations in your light curve. The smallest period that you can successfully measure in your data will have a value twice your sampling timescale. E.g., if you obtained observations every 2 minutes, the shortest period that you can accurately determine is 4 minutes. Shorter periods will not be well determined. This is the so called Nyquist criterion. Expressed in the frequency domain : if the time between observations is t, then the frequency at which to cut off your analysis is 1/2t, the Nyquist frequency. In mathematical jargon : |
