|
Detection
of superhumps in the CV 1RXS J053234.9+624755
1RXS J053234.9+624755 is a recently discovered CV
that has been reported in outburst by W. Kriebel
(cvnet-outburst, 2005 Mar 16) and P. Schmeer
(cvnet-outburst, 2005 Mar 16) on Mar 16.8 UT, 2005.
This cataclysmic variable is located at
R.A.=05h32m33.87s and Decl.=+62o47'52.1"
(J2000.0).
Mar 18/29, 2005 - Detection of
superhumps
I started a time-series photometry session on
this target at CBA Belgium Observatory on 2005, Mar
18.797 UT, using a 0.35-m f/6.3 telescope and
unfiltered ST-7 CCD. The observing session lasted
for > 5.5 hours (to be stopped for clouds), and the
resulting light curve clearly shows superhumps
with an amplitude of approx. 0.2 mag, superimposed
on a fading trend (decline rate of 0.6 mag/d).
The light curve below (fig. 1) - obtained after
removing the linear trend of decline - depicts
the superhumps. A superhump period
analysis, using the ANOVA method of Peranso (fig. 2), yields
a value of 0.0574 /+- 0.0010 d, classifying this
object as a new very short-period UGSU-type dwarf
nova. The phase diagram, folded over this best
period fit, is shown in fig. 3.
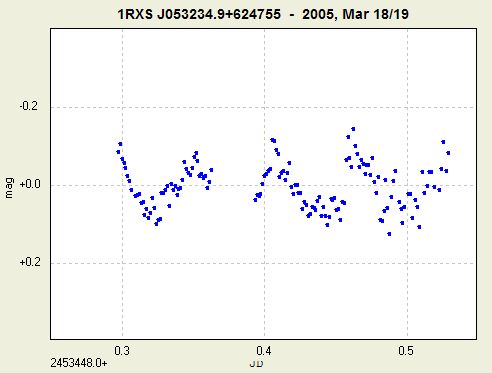
Fig. 1. Superhumps in 1RXS
J053234.9+624755 on 2005, Mar 18/19, after removal
of linear trend of decline
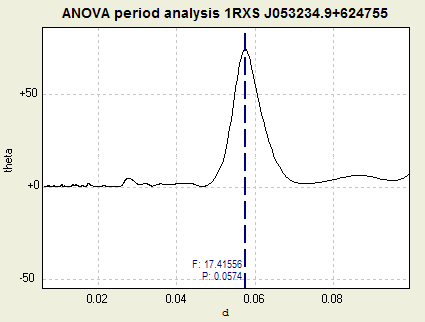
Fig. 2. ANOVA period analysis
yielding a Psh of 0.0574 d
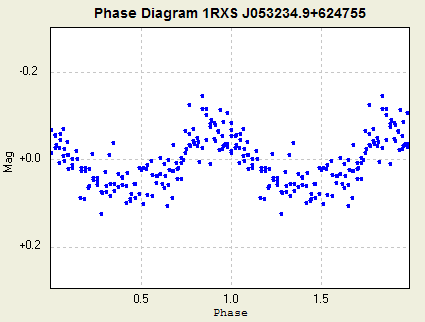
Fig. 3 Phase diagram by folding
the above mentioned Psh
March 23/24, 2005 observations The
next opportunity to observe 1RXS J053234.9+624755
from Belgium was on Mar 23/24, 2005. Although the
sky conditions were not very favourable (moonlight
and haze), I succeeded in accumulating unfiltered
data for about 7 hours, resulting in the light curve
below. Superhumps were very dominant, with an
amplitude of about 0.09 mag, but less intensive than
during their detection night (see above). Using
>500 observations, I derived a superhump period
of 0.0569 +/- 0.0008 d for Mar 23/24, using the
ANOVA method of Peranso. 
Fig. 4 Superhumps in 1RXS
J053234.9+624755 on 2005, Mar 23/24, after removal
of linear trend of decline
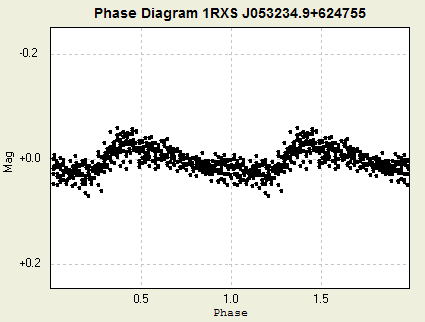
Fig. 5 Phase diagram by folding a Psh
of 0.0569d
Second stage of outburst
The first stage of the outburst,
described above, revealed a quite stable superhump
period at 0.0571 +/- 0.0002d, when using a
total of 1069 observations obtained by CBA observer
Tom Krajci (CBA Albuquerque) and myself. It covers
the time interval between JD 2,453,448.2
and JD 2,453,457.8. The
second stage of the outburst has been pretty well
covered by CBA observations too. We here present an
analysis of 1705 CBA observations, obtained between
JD 2,453,460 and 2,453,464. Data were submitted by
Arto Oksanen, Tom Krajci and myself.
The behaviour of 1RXSJ053234.9+624755 during this
second stage of the outburst is entirely different
from the first stage. The stable superhump has been
replaced by considerable flickering, showing
irregular variations with an amplitude of up to 0.9
mag over 40 min (!), and 0.6 mag variations over 15
min time intervals. See extracts in Fig. 6 and 7
below.
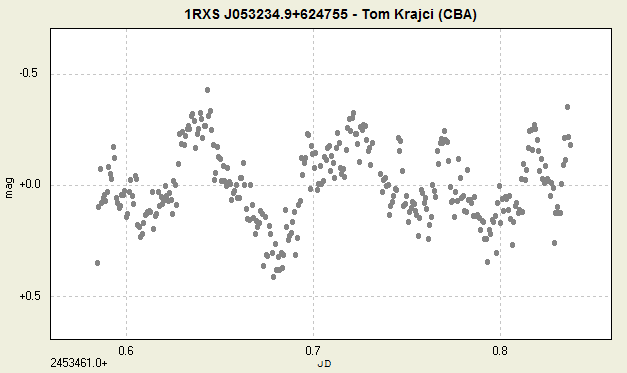
Fig. 6 Flickering with
amplitudes up to 0.9 mag is clearly present in this
data set of Tom Krajci (CBA New Mexico)

Fig. 7 Another example of
short-term flickering in 1RXS J053234.9+624755.
Light curve of Apr 02/03, 2005.
The observations of Apr 01/02, 2005, obtained by
Arto and myself, seem to indicate a superposition of
flickering on a longer-term periodic signal (Fig. 8).
Using various period analysis techniques in Peranso,
I tried to determine this long-term signal. The
various period analysis methods gave quite different
results, indicating there is no stable period in the
data. I also performed a multi-periodic analysis,
using the CLEANest method in Peranso. This
again confirmed the absence of a dominant signal.
Extending the analysis to all observations related
to this second stage of the outburst, revealed
similar results.
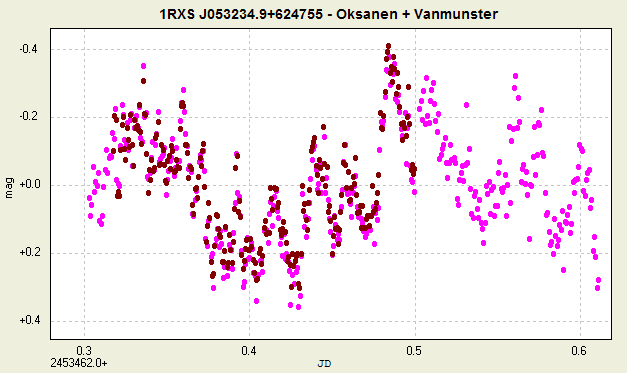
Fig. 8 - Apr 01/02, 2005
light curves of Arto Oksanen (CBA Finland - brown
dots)
and Tonny Vanmunster (CBA Belgium - pink dots)
Also on Apr 02/03, 2005 the light curve of
1RXSJ053234.9+624755 was still dominated by large
amplitude flickering (Fig. 7).
Flickering all over the place. What's next in the
light curve of this intriguing variable ?
|