The
May/June 2004 CBA campaign on the rare superoutburst
of LL And
The dwarf nova LL And was discovered in 1979 by
Wild. At the moment of its discovery, the object was
merely studied, and the variable star community had
to wait till 1993, before LL And again was found in
outburst (visual detection by myself on December
7.096 UT, 1993). Time-resolved CCD photometry during
that outburst at Kyoto University revealed the
existence of superhumps with a likely period of
0.05697 d (PASJ paper, 2004). In addition, Patterson
et al. (PASP paper, 2003) reported the detection of
a photometric quiescence periodicity of 0.055053 d,
which might be attributed to the orbital period of
the system.
The May 2004
outburst of LL And
On May 25th, 2004,
Patrick Schmeer announced his detection of a rare
outburst of LL And, using the 0.37-m Rigel Telescope
of the University of Iowa, reporting an unfiltered
CCD magnitude of 12.6 on a CCD image acquired on May
22.464 UT (JD +147.5). The CBA network immediately
announced an intensive monitoring campaign on LL
And, realising very well that the unfavourable
location of LL And in the morning sky (rising only
close to the start of twilight) would make the
campaign extremely difficult.
At present, the CBA
has accumulated a total of 2800 time-series CCD
observations of LL And, covering the time interval
between JD 2453151.8 and JD 2453158.0 (>6.1
days). Participating observers are : Donn Starkey
(CBA Indiana), Tonny Vanmunster (CBA
Belgium) and Jonathan Kemp / Sarah Tuttle (MDM
Observatory, 1.3-m telescope).
Photometric light curve from JD +151.8 till JD
+155.1
The resulting
photometric light curve of LL And can be split in
two sections : a first section covers the nights
from JD +151.8 till JD +155.1 (figure 1 below). The
second section covers the nights of JD +155.93 till
JD +158.0 (figure 5).
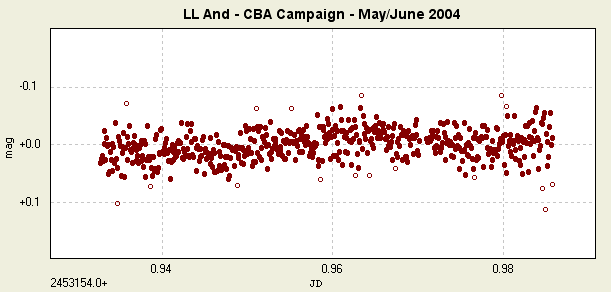
The initial
observation sets (up to JD +153.7, colored
blue-red-black-purple in figure 1 below) show no
evidence of any periodic modulation. The
fluctuations in this part of the light curve are
best explained by atmospheric extinction effects,
caused by the low altitude of the object and the
unfiltered observing. Starting with the observation
set around JD +153.9 (pink color) and JD +154.9
(brown color), a first hint of a weak modulation
starts to appear (see figure 2).

Fig. 1. LL And overall photometric
light curve covering JD +151.8 till +155.1.
Observations have been zero-averaged (all figures
are Peranso screenshots)
We attempted a period
analysis on this first section of the LL And light
curve, using periodic orthogonal polynomials to fit
the observations, and using the analysis of variance
(ANOVA) statistic to evaluate the quality of the
fit. This method for period analysis was recently
proposed by Schwarzenberg-Czerny (AJ, 460, L107-110,
1996). It strongly improves peak detection sensitivity
and damps alias periods. The next release (1.10) of Peranso
will include an implementation of this method (which
we refer to as ANOVA).

Fig. 2. LL And light
curve around JD +154.9 showing a first hint of a
weak modulation.
Open circles represent observations that are
excluded from period analysis calculations.
Using the ANOVA method
of Peranso 1.10, we find a weak signal (mean amplitude
about 0.06 mag) at 0.0546 +/- 0.0003 d, which could be
significant (further analysis to be done). Folding the
observations on this period yields the phase diagram
shown below (Fig 3).

Fig. 3. LL And phase diagram
with observations of section 1 of the light
curve
folded over a weak period of 0.0546 d. The red curve
is a spline-fitted curve.
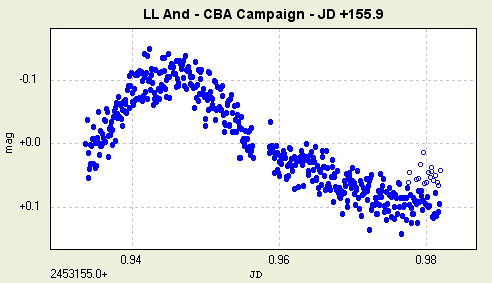
Photometric light curve from JD +155.93 till JD +158.0
The second section of the LL And CBA light curve
covers the nights of JD +155.93 till JD +158.0 (figure
5), which clearly show full-developed superhumps. They
emerged about 8 days after
the start of the present LL And outburst.

Fig. 4. LL And light curve on JD
+155.9, showing the first superhump development in the
present outburst.
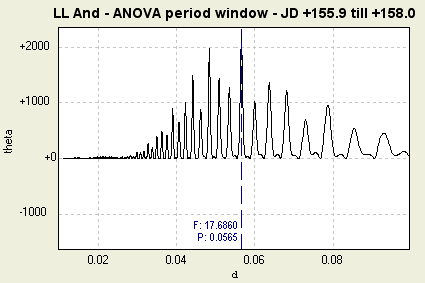
Figure 5 below shows the LL And light curve covering
the superhumping stage. Using the ANOVA method, we
derive a Psh value of 0.05654 +/- 0.00012 d.
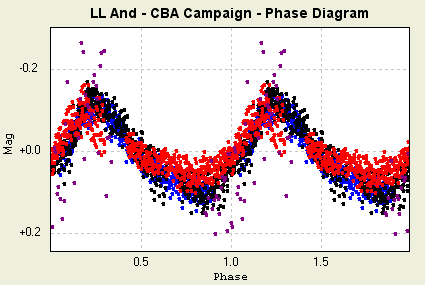
The corresponding period- and phase diagrams are shown
in figures 6 and 7. The amplitude of the superhump
modulation is about 0.26 mag.
Our superhump period
value is shorter than the value of 0.05697 d derived
at Kyoto University on the basis of CCD observations
from 1993, and is likely more accurate (we use 7x more
observations, covering a longer time span too).
Assuming an orbital period of 0.055053 d, the Kyoto
Univ. fractional superhump excess value was 3.5%,
which is unusually large for a short-period
system. It triggered a discussion on the location of
LL And on the evolutionary track of binary systems
(see http://arxiv.org/abs/astro-ph/0310626).
However, our superhump period value now yields a
fractional superhump excess value of 2.7%, which is
quite common for an UGSU-type dwarf nova.

Fig. 5. LL And light curve
covering the superhump stage (starting from JD +155.9)

Fig. 6. LL And period window (ANOVA
method) for superhump stage, yielding Psh = 0.05654 d

Fig. 7. Phase diagram for P = 0.05654 d
Evidently, we will
continue to monitor LL And over the coming nights
(weather permitting). If the present
superoutburst turns out to last for another week or
so, the object might even classify as a possible
UGWZ-type dwarf nova. Time will tell.